Skip directly to site content Skip directly to page options Skip directly to A-Z link Skip directly to A-Z link Skip directly to A-Z link
Volume 16, Number 3—March 2010
Dispatch

Parvovirus 4–like Virus in Blood Products

Jozsef Szelei, Kaiyu Liu, Yi Li, Sandra Fernandes, and Peter TijssenComments to Author 
Author affiliations: Institut National de la Recherche Scientifique–Institut Armand-Frappier, Laval, Quebec, Canada (J. Szelei, K. Liu, Yi Li, S. Fernandes, P. Tijssen); Central People’s Republic of China Normal University, Wuhan, People’s Republic of China (Y. Li)

Main Article

Figure 2

Construction of phylogenic trees for newly identified porcine viruses and comparison with previously identified prototype parvovirus 4 (PARV4)–like sequences. Sequences of other PARV4-like viruses indicated by the accession numbers were obtained from GenBank, and their origins are marked by letters (p, porcine; b, bovine; PARV4-g1, g2, g3, human parvovirus 4 genotypes 1, 2, and 3). ClustalW-aligned genomes (A) and nonstructural (NS) protein (B) and viral protein (VP) (C) were all trimmed to obta

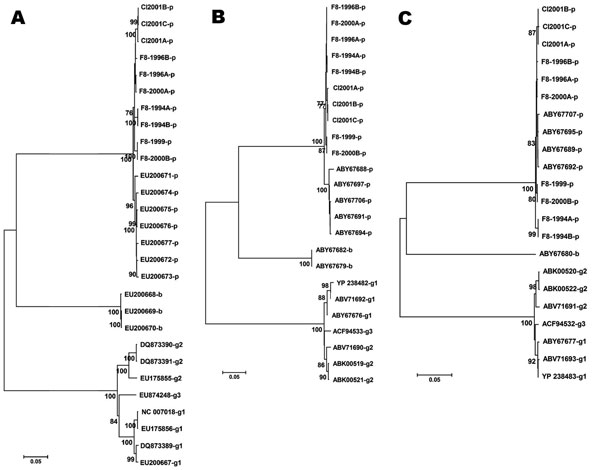
Figure 2. Construction of phylogenic trees for newly identified porcine viruses and comparison with previously identified prototype parvovirus 4 (PARV4)–like sequences. Sequences of other PARV4-like viruses indicated by the accession numbers were obtained from GenBank, and their origins are marked by letters (p, porcine; b, bovine; PARV4-g1, g2, g3, human parvovirus 4 genotypes 1, 2, and 3). ClustalW-aligned genomes (A) and nonstructural (NS) protein (B) and viral protein (VP) (C) were all trimmed to obtain sequences with similar lengths. All computer analysis was performed by using the neighbor-joining method. Branches corresponding to partitions reproduced in <70% bootstrap replicates are collapsed. The tree is drawn to scale, and the percentage of replicate trees in which the associated taxa clustered together in the bootstrap test (1,000 replicates) are shown below the branches. F8-year, year of the factor VIII lot; Cl-year, plasma samples and year of collection. Scale bar represents the number of nucleotide (A) or amino acid (B, C) substitutions per site.

Main Article

Page created: December 14, 2010
Page updated: December 14, 2010
Page reviewed: December 14, 2010
The conclusions, findings, and opinions expressed by authors contributing to this journal do not necessarily reflect the official position of the U.S. Department of Health and Human Services, the Public Health Service, the Centers for Disease Control and Prevention, or the authors' affiliated institutions. Use of trade names is for identification only and does not imply endorsement by any of the groups named above.
file_external