Volume 17, Number 10—October 2011
Letter
Use of Workplace Absenteeism Surveillance Data for Outbreak Detection
Bev Paterson , Richard Caddis, and David Durrheim
Figure
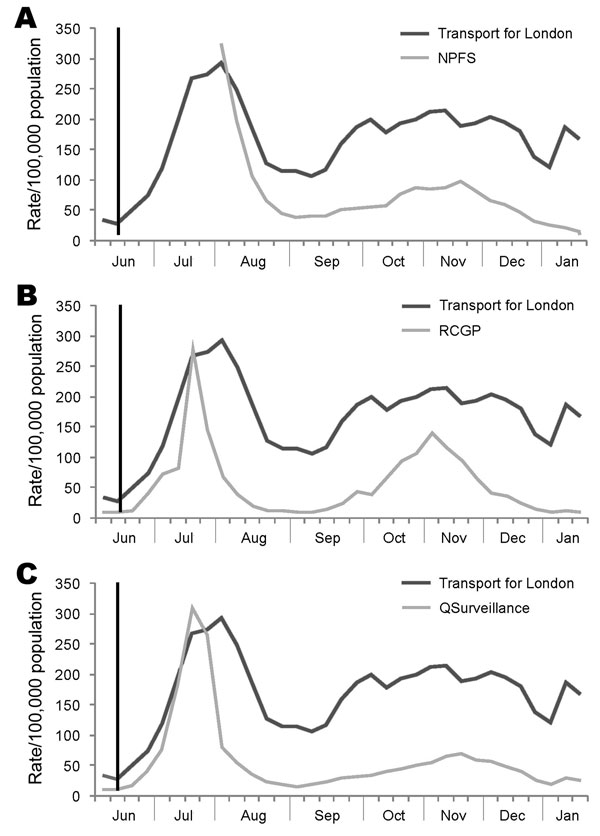
Figure. Comparison of transport for London absenteeism rates from influenza data to syndromic surveillance indicators of influenza-like illness rates, London, United Kingdom, 2009. A) National Pandemic Flu Service (NPFS); B) Royal College of General Practitioners (RCGP); and C) QSurveillance. Vertical black line indicates when the World Health Organization declared a pandemic on June 11, 2009. Source: Health Protection Agency, London, and Transport for London.
Page created: September 27, 2011
Page updated: September 27, 2011
Page reviewed: September 27, 2011
The conclusions, findings, and opinions expressed by authors contributing to this journal do not necessarily reflect the official position of the U.S. Department of Health and Human Services, the Public Health Service, the Centers for Disease Control and Prevention, or the authors' affiliated institutions. Use of trade names is for identification only and does not imply endorsement by any of the groups named above.