Volume 17, Number 2—February 2011
Research
Phocine Distemper Virus in Seals, East Coast, United States, 2006
Figure 2
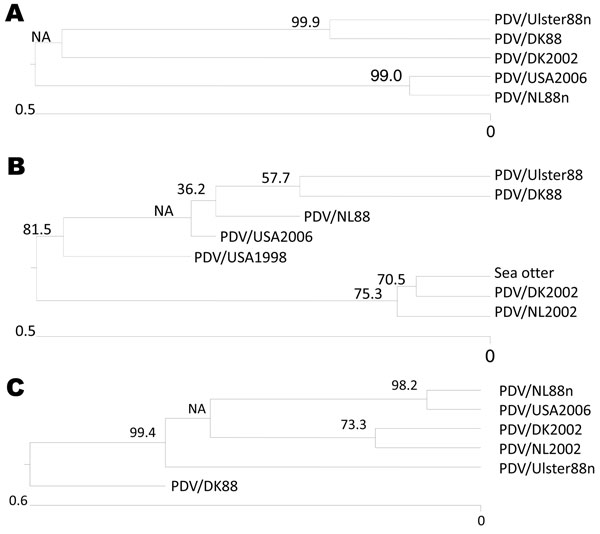
Figure 2. Phylogenic relationship of PDV/USA2006 to viruses from the 1988 and 2002 epizootics in Europe based on hemagglutinin (H) and phosphoprotein (P) gene sequences. A) Phocine distemper virus (PDV) H gene sequences used for the alignments were from PDV/DK2002 (lung), GenBank accession no. FJ648456; PDV/DK88 (isolated in Vero cells), GenBank accession no. Z36979; PDV/Ulster88n (isolated in Vero cells), PDV/NL88n (blood), GenBank accession no. D10371 (minus described changes in this study); and PDV/USA2006 (isolated in VeroDogSLAM cells), GenBank accession no. 1375698. B) PDV P gene sequences used for the alignments were from PDV/DK2002 (lung), GenBank accession no. –af52587; PDV/NL2002 (lung) GenBank accession no. af52588; PDV/DK88 (isolated in Vero cells), GenBank accession no. –x75960; PDV/Ulster88 (isolated in Vero cells), GenBank accession no. D10371; PDV/NL88 (isolated in Vero cells), GenBank accession no. af525289; PDV/USA1998, GenBank accession no. ay3323389; and PDV/USA2006 (isolated in VeroDogSLAM cells), GenBank accession no. 1375683. Unrooted neighbor-joining phylogenetic trees in A and B were constructed by using the MegAlign version 7.1 package (DNASTAR, www.dnastar.com) with the ClustalW method (www.clustal.org). C) Unrooted neighbor-joining phylogenetic tree for concatenated H and P squences constructed by using ClustalV. Scale bars denote number of nucleotide substitutions per site along the branches. Percentage bootstrap values, indicating the significance of clusters, are shown.
1These authors contributed equally to this article.