Volume 17, Number 3—March 2011
Research
Amplification of Emerging Viruses in a Bat Colony
Figure 3
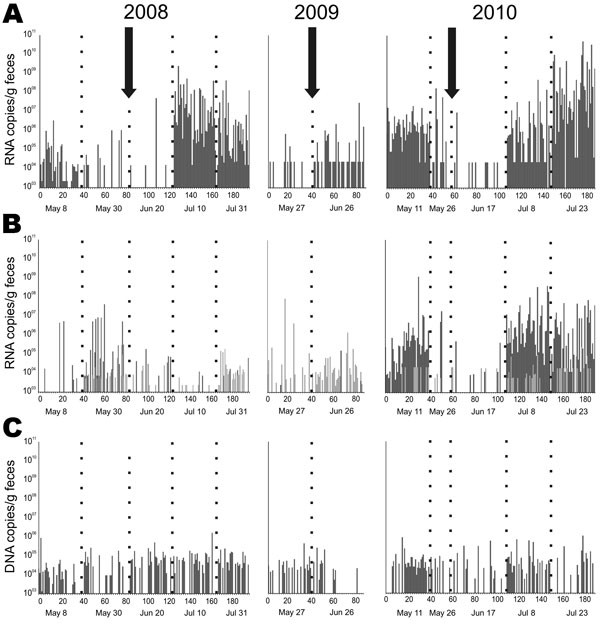
Figure 3. Detection frequency of bat viruses and virus nucleic acid concentrations over time. A) Coronavirus; B) astrovirus; C) adenovirus. Samples were obtained approximately every 3 weeks from the same Myotis myotis bat maternity roost in 3 different sampling years, 2008–2010. Each sample was tested by specific real-time reverse transcription–PCR (RT-PCR) with RNA/DNA concentrations per gram of feces given on the y axis. The arrows indicate the time of birth of the first pup. Numbers on the x-axis represent individual fecal pools tested, consisting of 5 single fecal pellets each. Five different sampling dates (below each panel) are shown by dotted lines for each sampling year. Empty columns indicate pools that tested negative. In panel B, light and dark gray bars identify results by 2 different real-time RT-PCRs that were used simultaneously to cover the large astrovirus diversity encountered.
1These authors contributed equally to this article.