Volume 17, Number 6—June 2011
Dispatch
Immunologic Changes during Pandemic (H1N1) 2009, China
Hong-Hui Shen1, Jun Hou1, Wei-Wei Chen, Bing-Ke Bai, Hai-Bin Wang, Tong-Sheng Guo, Ai-Xia Liu, Yong-Li Li, Min Zhao, Pan-Yong Mao, Jin Li, Bo-An Li , and Yuan-Li Mao1
Figure 1
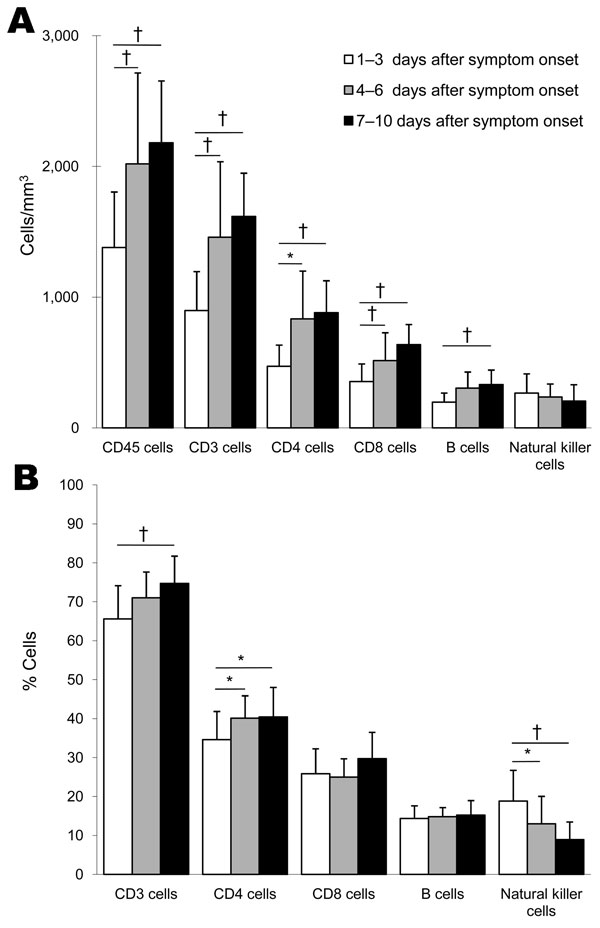
Figure 1. Flow cytometric analysis of peripheral blood lymphocyte subset counts of 28 patients with pandemic (H1N1) 2009, China. Counts and percentages are means. Error bars indicate SD. Each mean value was within the corresponding reference range. Lymphocyte subsets are as shown in the Table. A) Absolute count. B) Percentage of lymphocyte subset count compared with total lymphocyte count. *p<0.05; †p<0.01.
1These authors contributed equally to this article.
Page created: August 03, 2011
Page updated: August 03, 2011
Page reviewed: August 03, 2011
The conclusions, findings, and opinions expressed by authors contributing to this journal do not necessarily reflect the official position of the U.S. Department of Health and Human Services, the Public Health Service, the Centers for Disease Control and Prevention, or the authors' affiliated institutions. Use of trade names is for identification only and does not imply endorsement by any of the groups named above.