Volume 18, Number 10—October 2012
Research
Dengue Outbreaks in High-Income Area, Kaohsiung City, Taiwan, 2003–2009
Chia-Hsien Lin , Karin L. Schiøler, Martin R. Jepsen, Chi-Kung Ho, Shu-Hua Li, and Flemming Konradsen
Figure 5
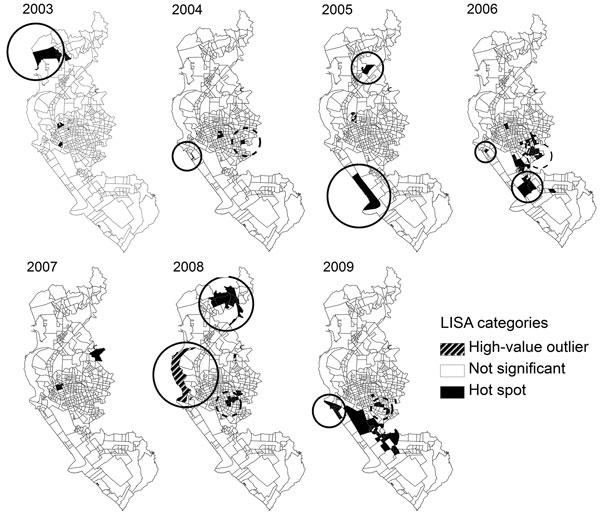
Figure 5. . . . Local indicator of spatial association (LISA) cluster maps of incidence rates for dengue virus infection during each epidemic period, Kaohsiung City, Taiwan, 2003–2009. High-value outlier, high-incidence Li (smallest administrative unit within each of 11 districts in Kaohsiung City) surrounded by low-incidence Lis; not significant, 0 spatial autocorrelation presented; Hot spot, high-incidence Li surrounded by high-incidence Lis. Hot-spot Lis circled with dashed lines are those that overlap with clusters of high residential density; hot-spot or high-value outlier Lis circled with solid lines are those that overlap with clusters of low residential density.
Page created: September 13, 2012
Page updated: September 13, 2012
Page reviewed: September 13, 2012
The conclusions, findings, and opinions expressed by authors contributing to this journal do not necessarily reflect the official position of the U.S. Department of Health and Human Services, the Public Health Service, the Centers for Disease Control and Prevention, or the authors' affiliated institutions. Use of trade names is for identification only and does not imply endorsement by any of the groups named above.