Volume 18, Number 11—November 2012
Dispatch
Effect of Latitude on Seasonality of Tuberculosis, Australia, 2002–2011
Jennifer H. MacLachlan , Caroline J. Lavender, and Benjamin C. Cowie
Figure 2
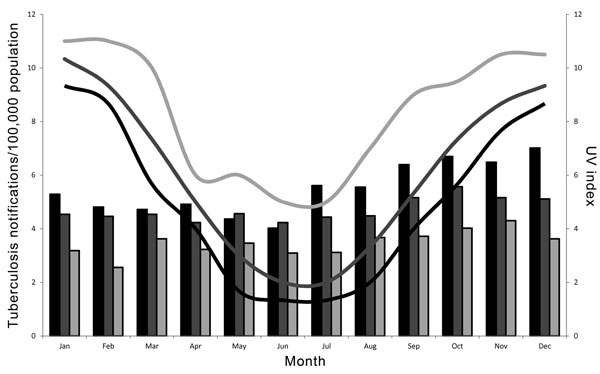
Figure 2. . . . Tuberculosis notifications per 100,000 population (bars) and ultraviolet (UV) index (lines), Australia 2002–2011. Black, south region; dark gray, central region; light gray, north region.
Page created: October 02, 2012
Page updated: October 02, 2012
Page reviewed: October 02, 2012
The conclusions, findings, and opinions expressed by authors contributing to this journal do not necessarily reflect the official position of the U.S. Department of Health and Human Services, the Public Health Service, the Centers for Disease Control and Prevention, or the authors' affiliated institutions. Use of trade names is for identification only and does not imply endorsement by any of the groups named above.