Migratory Birds, Ticks, and Crimean-Congo Hemorrhagic Fever Virus
Mats Lindeborg, Christos Barboutis, Christian Ehrenborg, Thord Fransson, Thomas G.T. Jaenson, Per-Eric Lindgren, Åke Lundkvist, Fredrik Nyström, Erik Salaneck

, Jonas Waldenström, and Björn Olsen
Author affiliations: Uppsala University, Uppsala, Sweden (M. Lindeborg, C. Ehrenborg, T.G.T. Jaenson, E. Salaneck, B. Olsen); Hellenic Ornithological Society and Natural History Museum of Crete, Crete, Greece (C. Barboutis); Swedish Museum of Natural History, Stockholm, Sweden (T. Fransson); Linköping University, Linköping, Sweden (P.-E. Lindgren, F. Nyström); Swedish Institute for Infectious Disease Control, Solna, Sweden (A. Lundkvist); and Linnaeus University, Kalmar, Sweden (J. Waldenström)
Main Article
Figure
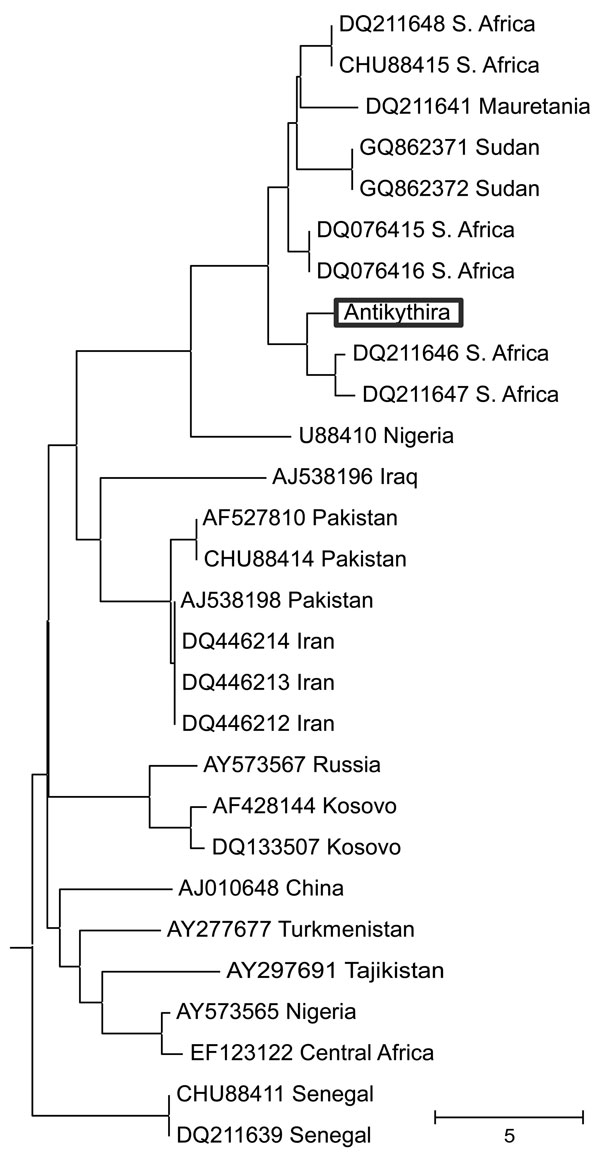
Figure. . Neighbor-joining tree of Crimean-Congo hemorrhagic fever virus small segment sequences retrieved from GenBank and the novel 127-bp sequence isolated in this study (boxed). The tree is drawn to scale, with branch lengths in the same units as those of the evolutionary distances used to infer the phylogenetic tree. A total of 127 positions were in the final dataset. Trees generated with maximum-likelihood and maximum-parsimony methods (not shown) exhibited nearly identical topology to this tree. The corresponding part of the Nairobi sheep disease virus small segment was used as an outgroup. The analyses were conducted in MEGA5 software (www.megasoftware.net) using a ClustalW alignment. Accession numbers and geographic origins of the sequences are shown. Scale bar indicates number of base differences per sequence. S. Africa, South Africa.
Main Article
Page created: November 21, 2012
Page updated: November 21, 2012
Page reviewed: November 21, 2012
The conclusions, findings, and opinions expressed by authors contributing to this journal do not necessarily reflect the official position of the U.S. Department of Health and Human Services, the Public Health Service, the Centers for Disease Control and Prevention, or the authors' affiliated institutions. Use of trade names is for identification only and does not imply endorsement by any of the groups named above.