Volume 18, Number 4—April 2012
Peer Reviewed Report Available Online Only
Multidisciplinary and Evidence-based Method for Prioritizing Diseases of Food-producing Animals and Zoonoses
Figure 2
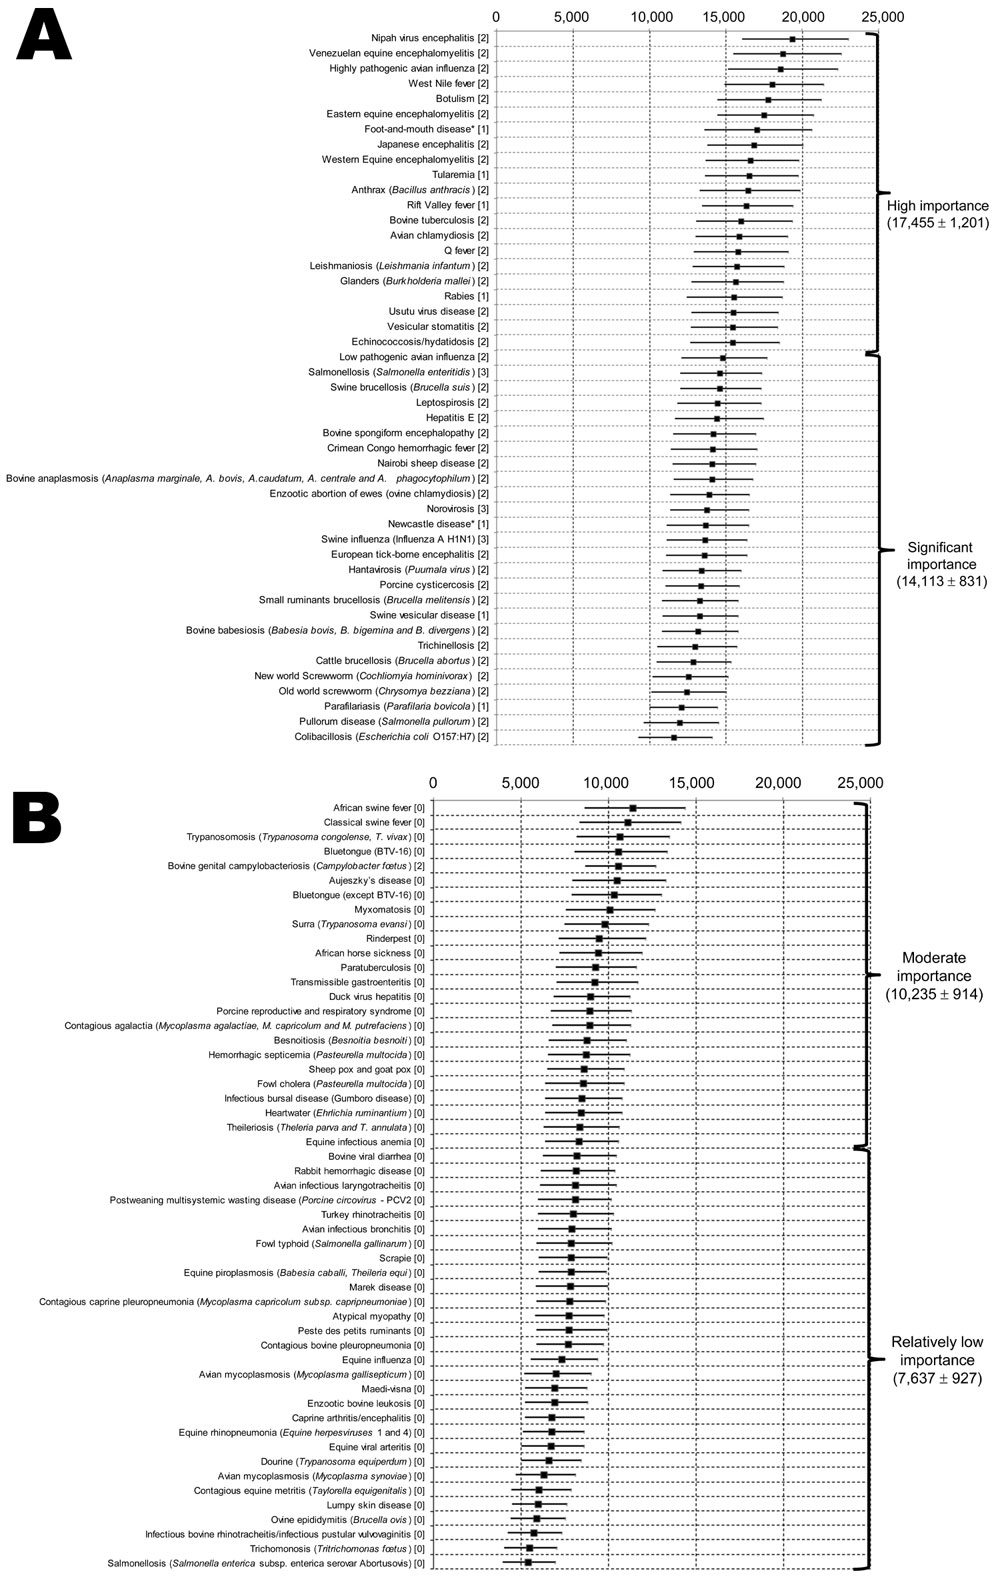
Figure 2. Classification and regression tree analysis showing grouping of diseases of food-producing animals and zoonoses into 4 subgroups by using overall weighted scores per disease as input, Europe. A) High importance and significant importance. B) Moderate importance and relatively low importance. Numbers at the top indicate overall weighting scores of pathogens. Squares indicate means, and error bars indicate 95% CIs. Causative agents are shown in parentheses on the left. Values on the left in brackets are zoonotic aspects codes: 2, rare; 1, accidental; 3, frequent; 0, nonzoonotic/common. Values on the right are mean ± SD weighting scores. *Foot-and-mouth disease and Newcastle disease were considered zoonotic in this study.
1These authors contributed equally to this article.