Skip directly to site content Skip directly to page options Skip directly to A-Z link Skip directly to A-Z link Skip directly to A-Z link
Volume 18, Number 5—May 2012
Research

Transmission Dynamics, Border Entry Screening, and School Holidays during the 2009 Influenza A (H1N1) Pandemic, China

Enfu Chen1, Simon Cauchemez1, Christl A. Donnelly, Lei Zhou, Luzhao Feng, Nijuan Xiang, Jiandong Zheng, Min Ye, Yang Huai, Qiaohong Liao, Zhibin Peng, Yunxia Feng, Hui Jiang, Weizhong Yang, Yu Wang, Neil M. FergusonComments to Author , and Zijian Feng
Author affiliations: Chinese Center for Disease Control and Prevention, Beijing, People’s Republic of China (H. Yu, L. Zhou, L. Feng, N. Xiang, J. Zheng, M. Ye, Y. Huai, Q. Liao, Z. Peng, Y. Feng, H. Jiang, W. Yang, Y. Wang, Z. Feng); Imperial College London, London, United Kingdom (S. Cauchemez, C.A. Donnelly, N.M. Ferguson)

Main Article

Figure 5

Effects of school holidays and border entry screening on influenza A(H1N1)pdm09 virus infections, People’s Republic of China, 2009. A) Observed (black points) and predicted (solid line) number of visits for influenza-like illness (ILI) attributable to A(H1N1)pdm09 from week 35 (ending September 6) through week 42 (ending October 25). National Day Holiday occurred from Thursday, October 1 (week 39), through Thursday, October 8 (week 40). A simple epidemic model was fitted to data for calendar wee

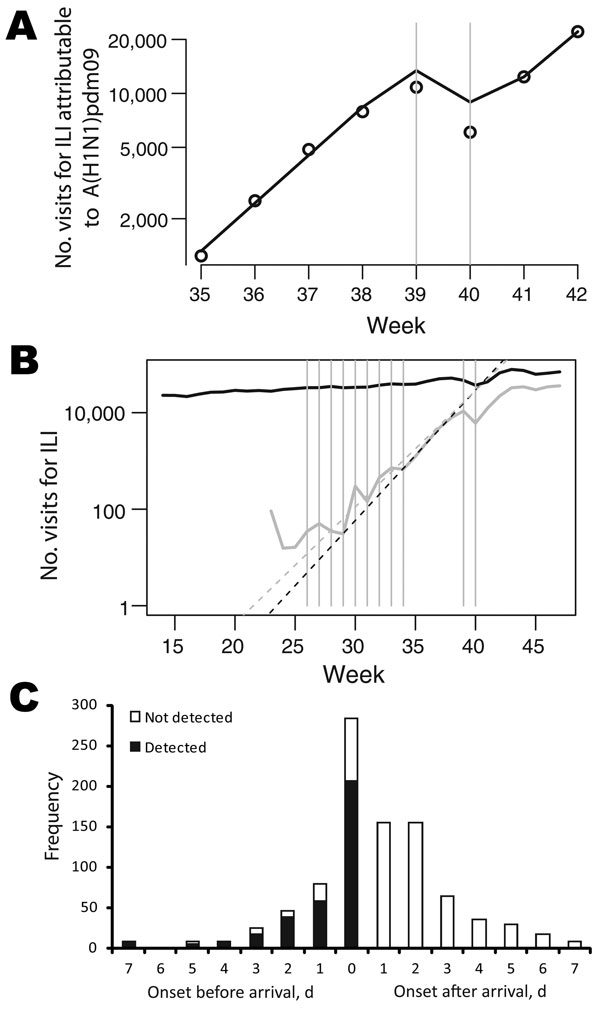
Figure 5. . Effects of school holidays and border entry screening on influenza A(H1N1)pdm09 virus infections, People’s Republic of China, 2009. A) Observed (black points) and predicted (solid line) number of visits for influenza-like illness (ILI) attributable to A(H1N1)pdm09 from week 35 (ending September 6) through week 42 (ending October 25). National Day Holiday occurred from Thursday, October 1 (week 39), through Thursday, October 8 (week 40). A simple epidemic model was fitted to data for calendar weeks before and after the National Day Holiday (gray bars) so that potential changes in reporting rates during holidays could be estimated. B) Number of visits for ILI. The black solid line shows raw numbers of visits for ILI; the gray solid line shows numbers corrected by the weekly proportion of ILI cases that are positive for A(H1N1)pdm09 virus. Gray dashed line shows growth rate in July-August. Black dashed line shows growth rate during the first 3 weeks of September. Gray bars indicate holiday periods. C) The distribution of intervals between symptom onset and arrival in China among confirmed international travel–related case-patients (N = 932).

Main Article

1These authors contributed equally to this article.

Page created: April 17, 2012
Page updated: April 17, 2012
Page reviewed: April 17, 2012
The conclusions, findings, and opinions expressed by authors contributing to this journal do not necessarily reflect the official position of the U.S. Department of Health and Human Services, the Public Health Service, the Centers for Disease Control and Prevention, or the authors' affiliated institutions. Use of trade names is for identification only and does not imply endorsement by any of the groups named above.
file_external