Volume 18, Number 7—July 2012
Dispatch
Electronic Event–based Surveillance for Monitoring Dengue, Latin America
Figure 1
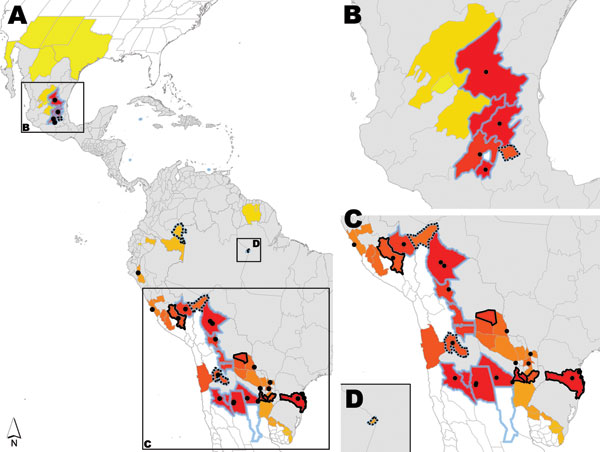
Figure 1. . . A) Regions in Latin America analyzed for dengue. B) Central Mexico; C) central South America; D) eastern Amazonas, Brazil. Thin gray lines indicate boundaries of first-level administrative units. Areas to which dengue was identified in the 2010 Yellow Book are shaded in gray. New dengue-endemic areas identified in the 2012 Yellow Book are outlined in blue. Dots indicate HealthMap dengue-related alerts. Modeled HealthMap alert probability density surface is shown in a gradient from yellow to red with yellow areas predicted as having lower alert densities and red areas predicted as having higher alert densities according to the model. Areas outlined with heavy black solid lines were classified as high HealthMap alert density but were not identified in either Yellow Book edition as dengue risk areas. Areas outlined with heavy black dashed lines were classified as low HealthMap alert density but were identified in the 2012 Yellow Book as areas at risk for dengue.
1Current affiliation: The Geisel School of Medicine at Dartmouth College, Lebanon, New Hampshire, USA.