Volume 18, Number 9—September 2012
Dispatch
Demographic Shift of Influenza A(H1N1)pdm09 during and after Pandemic, Rural India
Shobha Broor , Wayne Sullender, Karen Fowler, Vivek Gupta, Marc-Alain Widdowson, Anand Krishnan, and Renu B. Lal
Figure 2
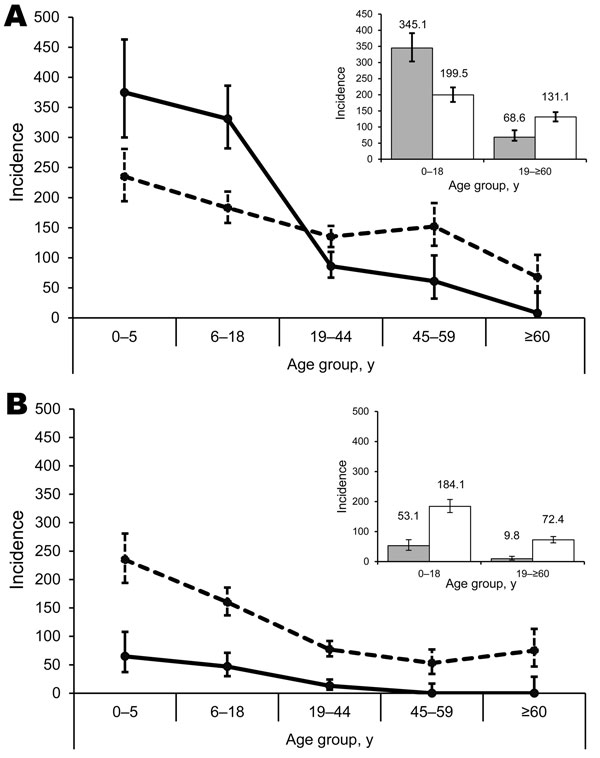
Figure 2. . . Incidence rates (per 1,000 person-years) for influenza A(H1N1)pdm09 (A) and influenza B (B) during pandemic (November 2009–January 2010; solid lines) and postpandemic (August–October 2010; dashed lines) periods in a rural community in northern India. Cumulative incidence rates for A(H1N1)pdm09 (A, inset) and influenza B (B, inset) during pandemic (gray bars) and postpandemic (white bars) periods are also shown, with incidence rates given on top of the bars. Error bars indicate 95% CIs.
Page created: August 16, 2012
Page updated: August 16, 2012
Page reviewed: August 16, 2012
The conclusions, findings, and opinions expressed by authors contributing to this journal do not necessarily reflect the official position of the U.S. Department of Health and Human Services, the Public Health Service, the Centers for Disease Control and Prevention, or the authors' affiliated institutions. Use of trade names is for identification only and does not imply endorsement by any of the groups named above.