Volume 19, Number 1—January 2013
CME ACTIVITY - Synopsis
Listeriosis Outbreaks and Associated Food Vehicles, United States, 1998–2008
Emily J. Cartwright, Kelly A. Jackson, Shacara D. Johnson, Lewis M. Graves, Benjamin J. Silk , and Barbara E. Mahon
Figure 2
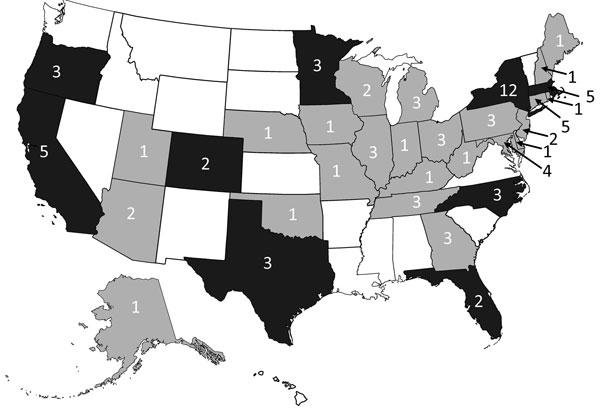
Figure 2. . . . Distribution of single-state single and multistate outbreaks of listeriosis, 1998–2008, Foodborne Disease Outbreak Surveillance System, United States, 1998–2008 (n = 24 outbreaks). Dark gray indicates single-state and multistate outbreaks, and light gray indicates multistate outbreaks. Values indicate total outbreaks in each state. The grand total of outbreaks indicated in each state is greater than 24 because of multistate outbreaks.
Page created: December 21, 2012
Page updated: December 21, 2012
Page reviewed: December 21, 2012
The conclusions, findings, and opinions expressed by authors contributing to this journal do not necessarily reflect the official position of the U.S. Department of Health and Human Services, the Public Health Service, the Centers for Disease Control and Prevention, or the authors' affiliated institutions. Use of trade names is for identification only and does not imply endorsement by any of the groups named above.