Volume 19, Number 3—March 2013
Research
Attribution of Foodborne Illnesses, Hospitalizations, and Deaths to Food Commodities by using Outbreak Data, United States, 1998–2008
Figure 2

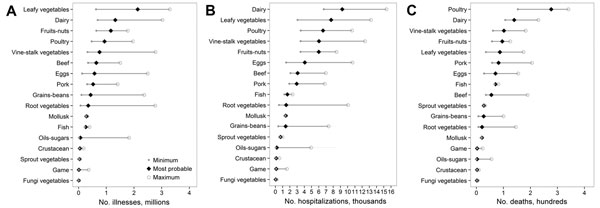
Figure 2. . . . . . . Minimum, most probable, and maximum estimates of the annual number of foodborne illnesses, hospitalizations, and deaths from all etiologies attributed to food commodities, United States, 1998–2008. A) Foodborne illnesses; 102,275 (1.1%) illnesses were not attributed to a commodity and are not shown. B) Foodborne illness–associated hospitalizations; 4,639 (8.1%) hospitalizations were not attributed to a commodity and are not shown. C) Foodborne illness–associated deaths; 366 (25.2%) deaths were not attributed to a commodity and are not shown. Minimum and maximum values represent extreme boundaries for the most probable estimate; they are not the SE of the most probable estimate. For commodities with outbreaks associated with only simple food vehicles, the minimum, maximum, and most probable estimate are the same. For commodities with outbreaks associated with both simple and complex foods, the minimum and maximum estimates reflect the different weighting given to outbreaks associated with complex foods relative to simple. When the most probable estimate for a commodity is close to the minimum estimate, most illnesses from outbreaks associated with complex foods were attributed to another commodity in the food implicated in the outbreak; when the most probable estimate for a commodity is close to the maximum estimate, most illnesses from outbreaks associated with complex foods were attributed to that commodity.