Volume 19, Number 5—May 2013
Research
Targeting Surveillance for Zoonotic Virus Discovery
Figure 1
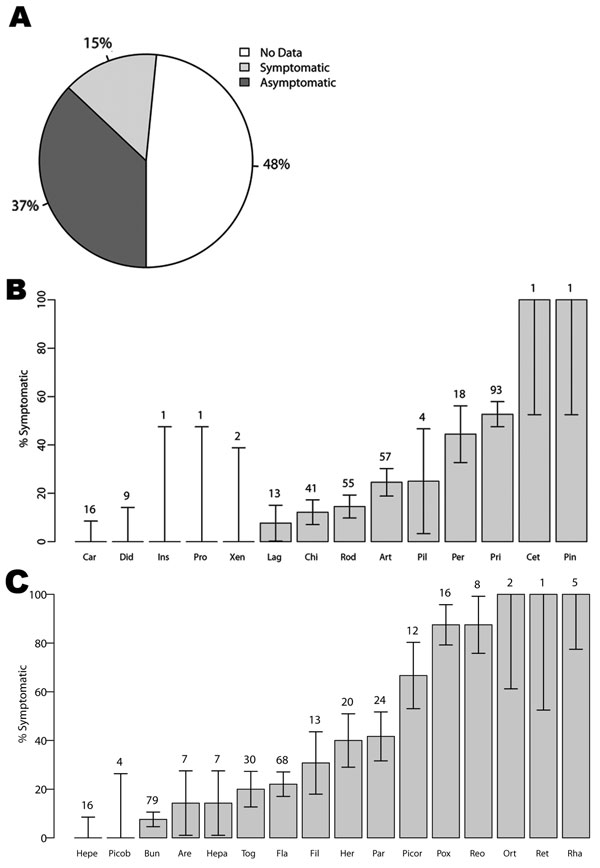
Figure 1. . A) Percentage of host–virus pair reports describing symptomatic (observable) disease, asymptomatic disease (no observable disease), or no data (no description of disease included). B) Percentage of symptomatic hosts by mammal taxonomic order. C) Percentage of viruses, by taxonomic family, for which hosts are reported symptomatic. SEs (error bars) were calculated assuming binomial error structure. The total number of each host order or virus family included in the database is given above each bar. All host orders and virus families in the database are included here, but analyses are limited to those host orders or virus families with at least 3 entries in the database. See the online Technical Appendix (wwwnc.cdc.gov/EID/article/19/5/12-1042-Techapp1.xlsx) for the full database of host–virus pairs and disease states.
1These authors contributed equally to this article.