Volume 19, Number 6—June 2013
Research
Active Surveillance for Influenza A Virus among Swine, Midwestern United States, 2009–2011
Cesar A. Corzo, Marie Culhane , Kevin Juleen, Evelyn Stigger-Rosser, Mariette F. Ducatez, Richard J. Webby, and James F. Lowe
Figure 2
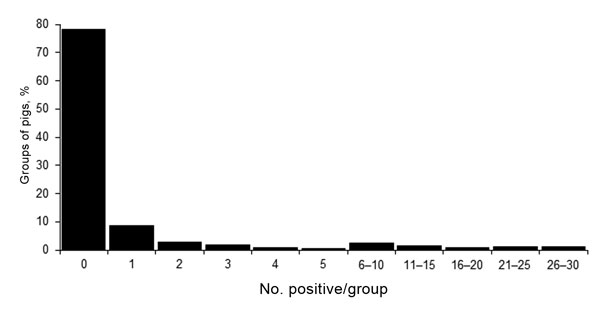
Figure 2. . Frequency distribution of number of nasal swab samples positive for influenza virus by real-time reverse transcription PCR, per group (total 540 groups of pigs), midwestern United States, June 2009–December 2011.
Page created: May 20, 2013
Page updated: May 20, 2013
Page reviewed: May 20, 2013
The conclusions, findings, and opinions expressed by authors contributing to this journal do not necessarily reflect the official position of the U.S. Department of Health and Human Services, the Public Health Service, the Centers for Disease Control and Prevention, or the authors' affiliated institutions. Use of trade names is for identification only and does not imply endorsement by any of the groups named above.