Volume 19, Number 6—June 2013
Research
Transmission Potential of Rift Valley Fever Virus over the Course of the 2010 Epidemic in South Africa
Figure 2

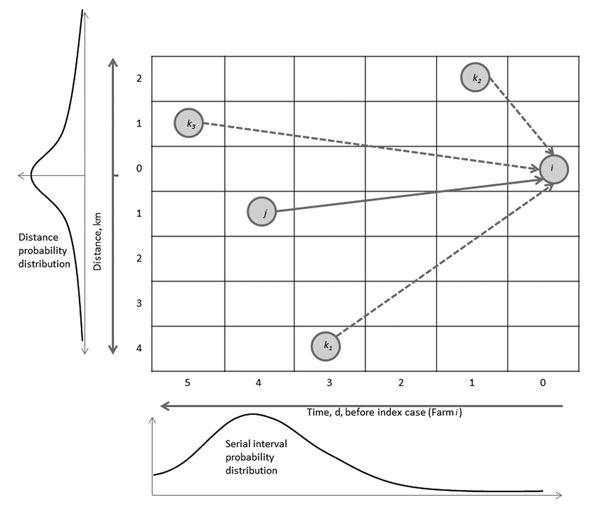
Figure 2. . Schematic representation of the Wallinga-Teunis algorithm extended with spatial information. Farm i could get infection from Farm j, but it also could get infection from Farms k1, k2, and k3. In this example, the most likely time difference between onset of symptoms is 4 days (based on the serial interval distribution, given below the x-axis), and the most likely distance between farms is short (<1 km). Therefore, Farm j is the most likely farm to have infected Farm i (this scenario maximizes the probability in both dimensions). See the online Technical Appendix (wwwnc.cdc.gov/EID/article/19/6/12-1641-Techapp1.pdf) for details.
Page created: May 20, 2013
Page updated: May 20, 2013
Page reviewed: May 20, 2013
The conclusions, findings, and opinions expressed by authors contributing to this journal do not necessarily reflect the official position of the U.S. Department of Health and Human Services, the Public Health Service, the Centers for Disease Control and Prevention, or the authors' affiliated institutions. Use of trade names is for identification only and does not imply endorsement by any of the groups named above.