Volume 19, Number 6—June 2013
Research
Transmission Potential of Rift Valley Fever Virus over the Course of the 2010 Epidemic in South Africa
Raphaëlle Métras , Marc Baguelin, W. John Edmunds, Peter N. Thompson, Alan Kemp, Dirk U. Pfeiffer, Lisa M. Collins, and Richard G. White
Figure 5
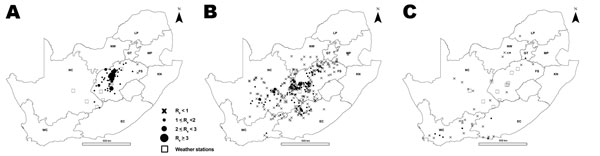
Figure 5. . Effective reproduction number (Re) per affected farm, by province, over the 2010 Rift Valley fever epidemic, South Africa. A) January and February. B) March and April. C) May and June. July and August are not displayed because no cases were reported in July, and Re was 0 for the only farm reported in August. NC, Northern Cape; NW, North West; LP, Limpopo; GT, Gauteng; MP, Mpumalanga; FS, Free State; KN, KwaZulu-Natal; EC, Eastern Cape; WC, Western Cape. The unmarked area to the right of center is Lesotho (no data).
Page created: May 20, 2013
Page updated: May 20, 2013
Page reviewed: May 20, 2013
The conclusions, findings, and opinions expressed by authors contributing to this journal do not necessarily reflect the official position of the U.S. Department of Health and Human Services, the Public Health Service, the Centers for Disease Control and Prevention, or the authors' affiliated institutions. Use of trade names is for identification only and does not imply endorsement by any of the groups named above.