Volume 19, Number 8—August 2013
Research
Emergency Department Visit Data for Rapid Detection and Monitoring of Norovirus Activity, United States
Figure 1
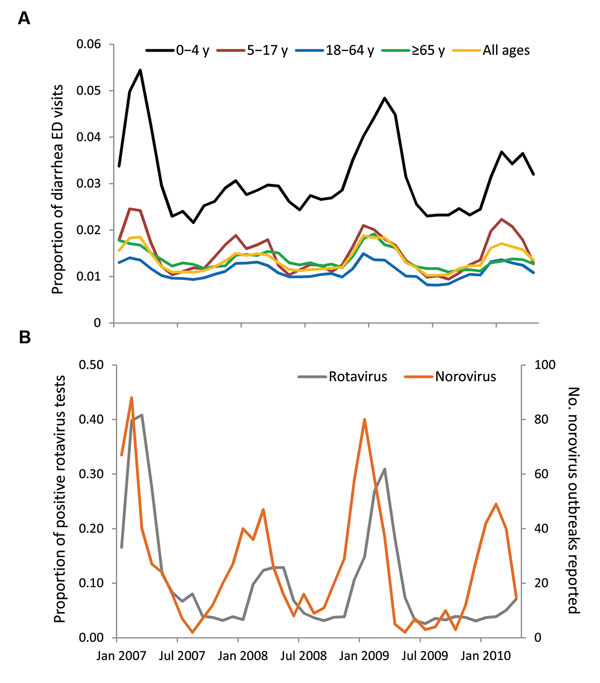
Figure 1. . . Proportion of BioSense emergency department (ED) visits for diarrhea subsyndrome (A) and norovirus and rotavirus surveillance data (B), United States, January 2007–April 2010. The proportion of ED visits mapped by chief complaint to diarrhea subsyndrome in the 6 states analyzed (Georgia, Missouri, Ohio, Pennsylvania, Tennessee, and Wyoming) and reported norovirus outbreak data displayed seasonal peaks in the winter months. This seasonal pattern was observed for all 5 age groups (0–4, 5–17, 18–64, >65 years, and all ages); a higher proportion of ED visits for diarrhea was seen among children <5 years of age. Rotavirus activity, as measured by the proportion of positive antigen tests, also showed winter seasonality, with peaks that lagged behind those of norovirus.