Volume 19, Number 8—August 2013
Research
Emergency Department Visit Data for Rapid Detection and Monitoring of Norovirus Activity, United States
Brian Rha , Sherry Burrer, Soyoun Park, Tarak Trivedi, Umesh D. Parashar, and Benjamin A. Lopman
Figure 3
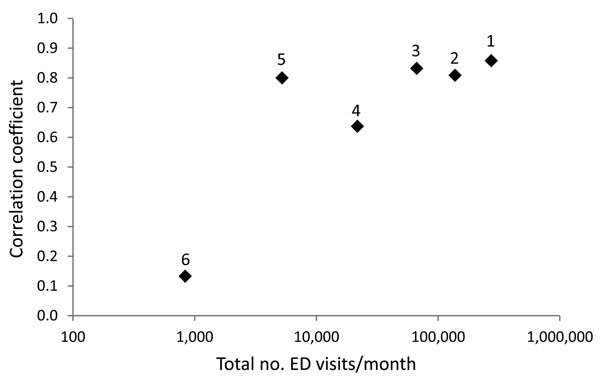
Figure 3. . . Correlation between the proportion of BioSense emergency department (ED) visits mapped by chief complaint to diarrhea subsyndrome and norovirus outbreaks as a function of total BioSense ED visits per month using state-specific data for the 6 states analyzed, United States, January 2007–April 2010. Correlation coefficients for each state are plotted by corresponding total ED visits/month on a logarithmic scale. Models tended to perform better in states with greater total ED visits. Higher correlation (R>0.60) was observed for states with >5,000 BioSense ED visits/month. State number labels on data points correspond to those in Table 2.
Page created: July 18, 2013
Page updated: July 18, 2013
Page reviewed: July 18, 2013
The conclusions, findings, and opinions expressed by authors contributing to this journal do not necessarily reflect the official position of the U.S. Department of Health and Human Services, the Public Health Service, the Centers for Disease Control and Prevention, or the authors' affiliated institutions. Use of trade names is for identification only and does not imply endorsement by any of the groups named above.