Volume 19, Number 8—August 2013
Research
Emergency Department Visit Data for Rapid Detection and Monitoring of Norovirus Activity, United States
Brian Rha , Sherry Burrer, Soyoun Park, Tarak Trivedi, Umesh D. Parashar, and Benjamin A. Lopman
Figure 4
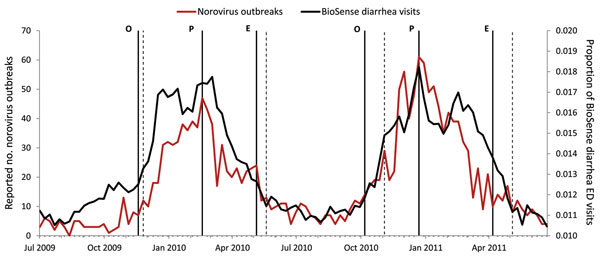
Figure 4. . . Estimation of norovirus season time markers using BioSense data on emergency department (ED) visits mapped by chief complaint to diarrhea subsyndrome, United States, 2009–2011. Observed season time markers (solid vertical lines) as defined by norovirus outbreak data are labeled as follows: season onset (O), season peak (P), and season end (E). Applying these rules yielded estimates for each season marker (dotted vertical lines) within 2 weeks of observed dates for the 2009–2010 season and within 4 weeks of observed dates for the 2010–2011 season.
Page created: July 18, 2013
Page updated: July 18, 2013
Page reviewed: July 18, 2013
The conclusions, findings, and opinions expressed by authors contributing to this journal do not necessarily reflect the official position of the U.S. Department of Health and Human Services, the Public Health Service, the Centers for Disease Control and Prevention, or the authors' affiliated institutions. Use of trade names is for identification only and does not imply endorsement by any of the groups named above.