Volume 2, Number 4—October 1996
Synopsis
A Mathematical Model and CD4+ Lymphocyte Dynamics in HIV Infection
Figure 2
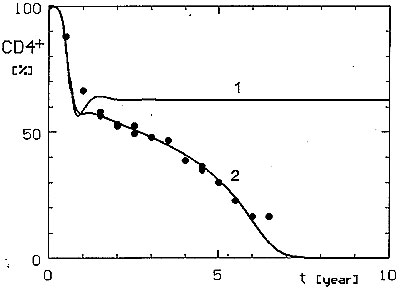
Figure 2. Comparison of only linear (curve 1, v =1.0) T-helper activity decrease with non-linear (standard curve 2, v = 1.6). *CD4+ cell observed values are depicted as circles and those of CD8+ lymphocytes as squares. Both simulated and observed values are depicted as a percentage of normal CD4+ lymphocyte numbers (the normal value of CD8+ lymphocytes is thus 66.7%).
Page created: December 21, 2010
Page updated: December 21, 2010
Page reviewed: December 21, 2010
The conclusions, findings, and opinions expressed by authors contributing to this journal do not necessarily reflect the official position of the U.S. Department of Health and Human Services, the Public Health Service, the Centers for Disease Control and Prevention, or the authors' affiliated institutions. Use of trade names is for identification only and does not imply endorsement by any of the groups named above.