Volume 2, Number 4—October 1996
Synopsis
A Mathematical Model and CD4+ Lymphocyte Dynamics in HIV Infection
Figure 3
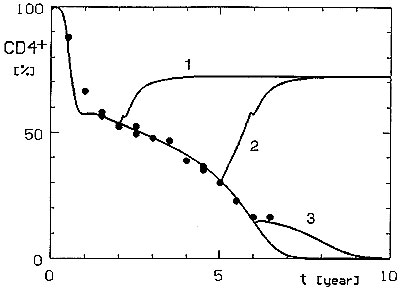
Figure 3. Simulated effect of permanent AZT treatment (![]() = 0.005) started 2m 5m or 6 years after the acquisition of HIV infection—curves 1, 2, and 3, respectively.
= 0.005) started 2m 5m or 6 years after the acquisition of HIV infection—curves 1, 2, and 3, respectively.
Page created: December 21, 2010
Page updated: December 21, 2010
Page reviewed: December 21, 2010
The conclusions, findings, and opinions expressed by authors contributing to this journal do not necessarily reflect the official position of the U.S. Department of Health and Human Services, the Public Health Service, the Centers for Disease Control and Prevention, or the authors' affiliated institutions. Use of trade names is for identification only and does not imply endorsement by any of the groups named above.