Volume 20, Number 1—January 2014
Dispatch
Epidemiology of Influenza A Virus among Black-headed Gulls, the Netherlands, 2006–2010
Josanne H. Verhagen, Frank Majoor, Pascal Lexmond, Oanh Vuong, Giny Kasemir, Date Lutterop, Albert D.M.E. Osterhaus, Ron A.M. Fouchier, and Thijs Kuiken
Figure 1
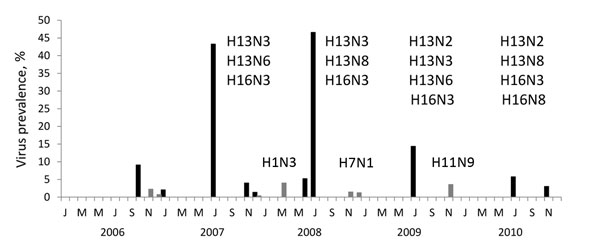
Figure 1. Avian influenza virus prevalence among 7,511 black-headed gulls, the Netherlands, 2006–2010. Cloacal and oropharyngeal samples were collected once from each gull for virus detection. Influenza virus subtypes detected are shown above virus positives. Bars indicate virus prevalence (No. PCR-positive samples/no. gulls sampled per month). Black bars represent gulls in their first year (FY) of life, comprising nestling and fledgling stages; gray bars represent after-first year (AFY) gulls.
Page created: January 03, 2014
Page updated: January 03, 2014
Page reviewed: January 03, 2014
The conclusions, findings, and opinions expressed by authors contributing to this journal do not necessarily reflect the official position of the U.S. Department of Health and Human Services, the Public Health Service, the Centers for Disease Control and Prevention, or the authors' affiliated institutions. Use of trade names is for identification only and does not imply endorsement by any of the groups named above.