Volume 20, Number 10—October 2014
Research
Lyme Disease, Virginia, USA, 2000–2011
Figure 5
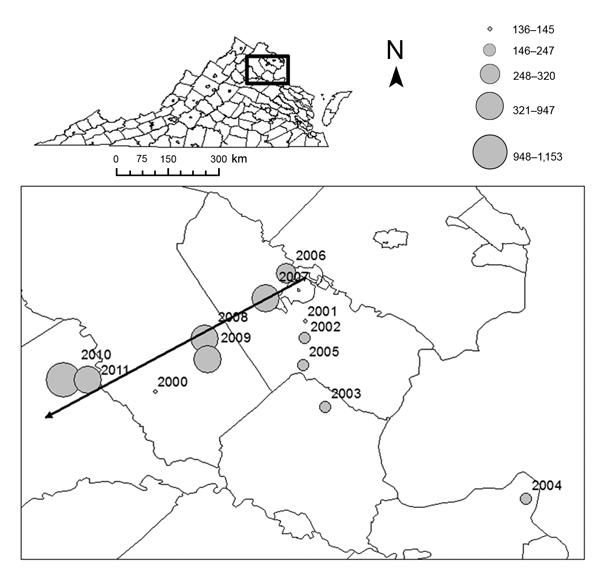
Figure 5. Centroids of annual incidence, by county, Virginia, 2000–2011. The size of each circle represents the annual number of cases reported by the Virginia Department of Health and is proportional to annual incidence (cases/100,000 population). Black arrow represents the mean linear direction of annual movement among centroids during 2006–2011 (these years indicate the recent dramatic increase in Lyme disease incidence in Virginia).
The reference has no authors. Please proof carefully. (in reference 6 "Goddard J. Ecological studies of, 1992").
Medline indexes "Va J Sci" but cannot find a listing for reference 12 "Casteel, Sonenshine, 1996". Please check the reference for accuracy.
Medline indexes "Glob Ecol Biogeogr" but cannot find a listing for reference 25 "Diuk-Wasser, Vourc’h, Cislo, Hoen, Melton, Hamer, et al., 2010". Please check the reference for accuracy.
Medline cannot find the journal "Southwest Entomologist" (in reference 33 "Trout, Steelman, Szalanski, 2009"). Please check the journal name.