Volume 20, Number 5—May 2014
Dispatch
Influenza A Subtype H3 Viruses in Feral Swine, United States, 2011–2012
Zhixin Feng, John A. Baroch, Li-Ping Long, Yifei Xu, Frederick L. Cunningham, Kerri Pedersen, Mark W. Lutman, Brandon S. Schmit, Andrew S. Bowman, Thomas J. DeLiberto, and Xiu-Feng Wan
Figure 1
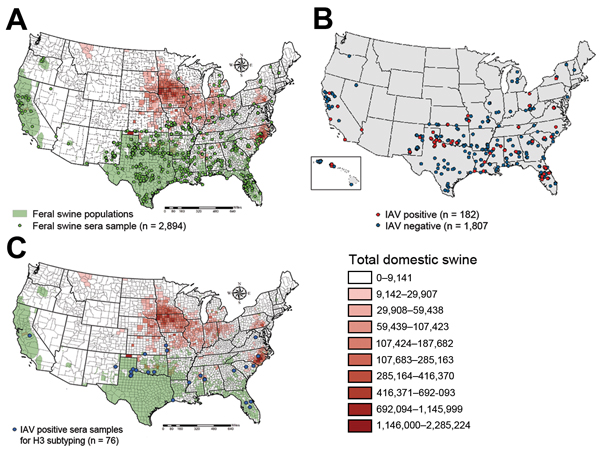
Figure 1. Geographic distributions of seum samples from feral swine, United States, 2011–2012A) Of 1,989 samples tested by ELISA, 182 were positive (red) and 1,807 were negative (blue)B) The 76 samples (blue) were selected for hemagglutination-inhibition and microneutralization subtypingC) The distributions of feral swine (green) and domestic swine (orange) were also marked (A and C).
Page created: April 17, 2014
Page updated: April 17, 2014
Page reviewed: April 17, 2014
The conclusions, findings, and opinions expressed by authors contributing to this journal do not necessarily reflect the official position of the U.S. Department of Health and Human Services, the Public Health Service, the Centers for Disease Control and Prevention, or the authors' affiliated institutions. Use of trade names is for identification only and does not imply endorsement by any of the groups named above.