Skip directly to site content Skip directly to page options Skip directly to A-Z link Skip directly to A-Z link Skip directly to A-Z link
Volume 20, Number 7—July 2014
Synopsis

Epidemiology, Clinical Manifestations, and Outcomes of Streptococcus suis Infection in Humans

Vu Thi Lan Huong1, Ngo Ha1, Nguyen Tien Huy1, Peter Horby, Ho Dang Trung Nghia, Vu Dinh Thiem, Xiaotong Zhu, Ngo Thi Hoa, Tran Tinh Hien, Javier Zamora, Constance Schultsz, Heiman Frank Louis Wertheim, and Kenji HirayamaComments to Author 
Author affiliations: Oxford University Clinical Research Unit, Hanoi, Vietnam (V.T.L. Huong, P. Horby, H.F.L. Wertheim); University of Oxford, Oxford, UK (V.T.L. Huong, P. Horby, H.F.L. Wertheim, N.T. Hoa); Nagasaki University, Nagasaki, Japan (N. Ha, N.T. Huy, X. Zhu, K. Hirayama); Oxford University Clinical Research Unit, Ho Chi Minh City, Vietnam (H.D.T. Nghia, N.T. Hoa, T.T. Hien, C. Schultsz); National Institute of Hygiene and Epidemiology, Hanoi (V.D. Thiem); Ramón y Cajal Hospital, Madrid, Spain (J. Zamora); CIBER Epidemiologia y Salud Publica, Madrid (J. Zamora); Pham Ngoc Thach University of Medicine, Ho Chi Minh City (H.D.T. Nghia); University of Amsterdam, Amsterdam, the Netherlands (C. Schultsz)

Main Article

Figure 3

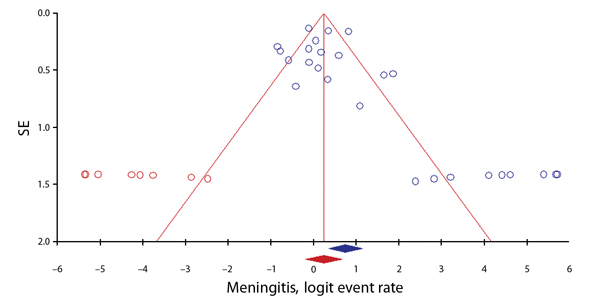
Funnel plot showing evidence of publication bias among 26 studies in a meta-analysis of meningitis rates in Streptococcus suis infection. Each blue circle represents each study in the meta-analysis, forming an asymmetric funnel plot with a pooled log event rate (blue rhombus). Eight missing studies (red circles) added in the left side through the trim and fill method to make the plot more symmetric and gave an adjusted log event rate (red rhombus), which was lower than the original one.

Figure 3. Funnel plot showing evidence of publication bias among 26 studies in a meta-analysis of meningitis rates in Streptococcus suis infectionEach blue circle represents each study in the meta-analysis, forming an asymmetric funnel plot with a pooled log event rate (blue rhombus)Eight missing studies (red circles) added in the left side through the trim and fill method to make the plot more symmetric and gave an adjusted log event rate (red rhombus), which was lower than the original one.

Main Article

1These authors contributed equally to this article.

Page created: June 17, 2014
Page updated: June 17, 2014
Page reviewed: June 17, 2014
The conclusions, findings, and opinions expressed by authors contributing to this journal do not necessarily reflect the official position of the U.S. Department of Health and Human Services, the Public Health Service, the Centers for Disease Control and Prevention, or the authors' affiliated institutions. Use of trade names is for identification only and does not imply endorsement by any of the groups named above.
file_external