Volume 20, Number 7—July 2014
Research
Staphylococcus aureus Infections in New Zealand, 2000–2011
Deborah A. Williamson , Jane Zhang, Stephen R. Ritchie, Sally A. Roberts, John D. Fraser, and Michael G. Baker
Figure 3
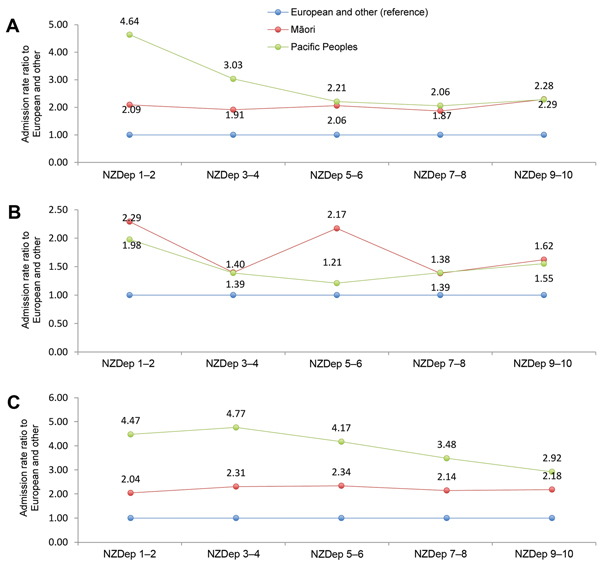
Figure 3. Admission rate ratios for Staphylococcus aureus–associated hospital discharges by ethnicity according to level of deprivation, New Zealand, 2000–2011A) Staphylococcal sepsis; B) staphylococcal pneumonia; C) staphylococcal skin and soft tissue infectionsNZDep, New Zealand Deprivation Index.
Page created: June 17, 2014
Page updated: June 17, 2014
Page reviewed: June 17, 2014
The conclusions, findings, and opinions expressed by authors contributing to this journal do not necessarily reflect the official position of the U.S. Department of Health and Human Services, the Public Health Service, the Centers for Disease Control and Prevention, or the authors' affiliated institutions. Use of trade names is for identification only and does not imply endorsement by any of the groups named above.