Volume 20, Number 8—August 2014
Research
Rapid Whole-Genome Sequencing for Surveillance of Salmonella enterica Serovar Enteritidis
Figure 2
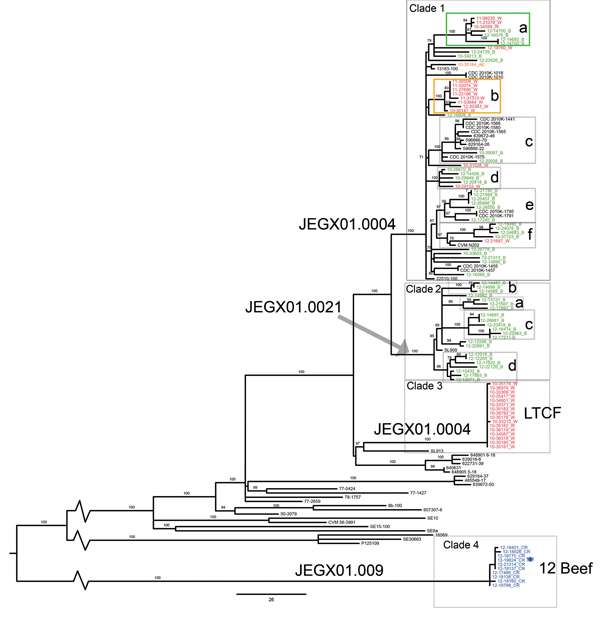
Figure 2. Figure 2. Maximum-likelihood tree of population structure of Salmonella enterica serovar Enteritidis isolates obtained in New York and neighboring states, USA. The tree was inferred by using a general time-reversible model with a gamma distribution, which was inferred to be the best fit model by the maximum-likelihood method implemented in MEGA 5.1 (22). Values on branches are bootstrap values based on 150 bootstrap replicates. Pulsed-field gel electrophoresis (PFGE) types are indicated on branches. Labels of isolates are colored according to their New York State Department of Health Wadsworth Laboratories multilocus variable-number tandem-repeat subtype designation. Green, MLVA subtype B; red, MLVA subtype W; orange, MLVA subtype AE; blue, MLVA subtype CR; black, MLVA subtype data missing and isolates from Allard et al. (11) . Rectangles indicate well-supported clusters of at least 3 isolates; letters within the rectangles correspond to the cluster designation in the Table. LTCF, long-term care facility. Scale bar indicates single-nucleotide polymorphisms per site.