Skip directly to site content Skip directly to page options Skip directly to A-Z link Skip directly to A-Z link Skip directly to A-Z link
Volume 20, Number 8—August 2014
Dispatch

Antibodies against MERS Coronavirus in Dromedary Camels, Kenya, 1992–2013

Victor M. Corman1, Joerg Jores1, Benjamin Meyer1, Mario Younan, Anne M. Liljander, Mohammed Y. Said, Ilona Gluecks, Erik Lattwein, Berend-Jan Bosch, Jan Felix Drexler, Set Bornstein, Christian DrostenComments to Author , and Marcel A. Müller
Author affiliations: University of Bonn Medical Centre, Bonn, Germany (V.M. Corman, B. Meyer, J.F. Drexler, C. Drosten, M.A. Müller); International Livestock Research Institute, Nairobi, Kenya (J. Jores, A. Liljander, M.Y. Said); Vétérinaires Sans Frontières Germany, Nairobi (M. Younan); Vétérinaires Sans Frontières Suisse, Nairobi (I. Gluecks); EUROIMMUN AG, Lübeck, Germany (E. Lattwein); Utrecht University, Utrecht, the Netherlands (B.-J. Bosch); National Veterinary Institute, Uppsala, Sweden (S. Bornstein)

Main Article

Figure

Greater Horn of Africa and Kenya. A) Arabian Peninsula and neighboring countries in the Greater Horn of Africa. B) Detailed map of Kenya showing sampling sites in 7 counties (Turkana, Baringo, Laikipia, Marsabit, Isiolo, Mandera, and Wajir) for Middle East respiratory syndrome coronavirus (MERS-CoV). Counties were assigned to 3 regions named after the former administrative provinces of Rift Valley, Eastern, and Northeastern (left to right). The 3 sampling regions are indicated in shades of green

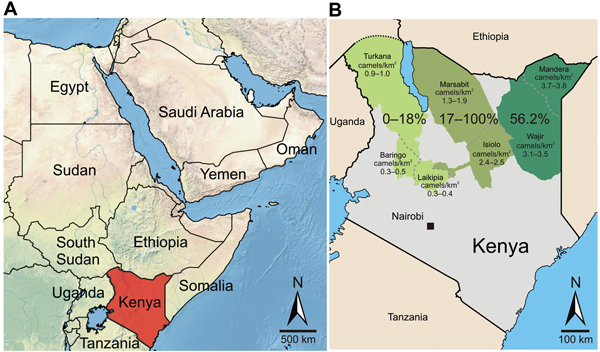
Figure. Greater Horn of Africa and KenyaA) Arabian Peninsula and neighboring countries in the Greater Horn of AfricaB) Detailed map of Kenya showing sampling sites in 7 counties (Turkana, Baringo, Laikipia, Marsabit, Isiolo, Mandera, and Wajir) for Middle East respiratory syndrome coronavirus (MERS-CoV)Counties were assigned to 3 regions named after the former administrative provinces of Rift Valley, Eastern, and Northeastern (left to right)The 3 sampling regions are indicated in shades of green and other counties are indicated in grayPercentages of camels positive for antibodies against MERS-CoV are shown with the density of camels (individuals/km2) for the analyzed regions during 2 periods (1991–2000 and 2000–2013)Serosurveys were performed during 1992–2013Camel population numbers were determined for 1991–2000 and 2000–2013Maps were created by using data from http://www.naturalearthdata.com.

Main Article

1These authors contributed equally to this article.

Page created: May 06, 2014
Page updated: May 06, 2014
Page reviewed: May 06, 2014
The conclusions, findings, and opinions expressed by authors contributing to this journal do not necessarily reflect the official position of the U.S. Department of Health and Human Services, the Public Health Service, the Centers for Disease Control and Prevention, or the authors' affiliated institutions. Use of trade names is for identification only and does not imply endorsement by any of the groups named above.
file_external