Volume 20, Number 9—September 2014
Dispatch
Incidence of Cronobacter spp. Infections, United States, 2003–2009
Mary E. Patrick , Barbara E. Mahon, Sharon A. Greene, Joshua Rounds, Alicia Cronquist, Katie Wymore, Effie Boothe, Sarah Lathrop, Amanda Palmer, and Anna Bowen
Figure 2
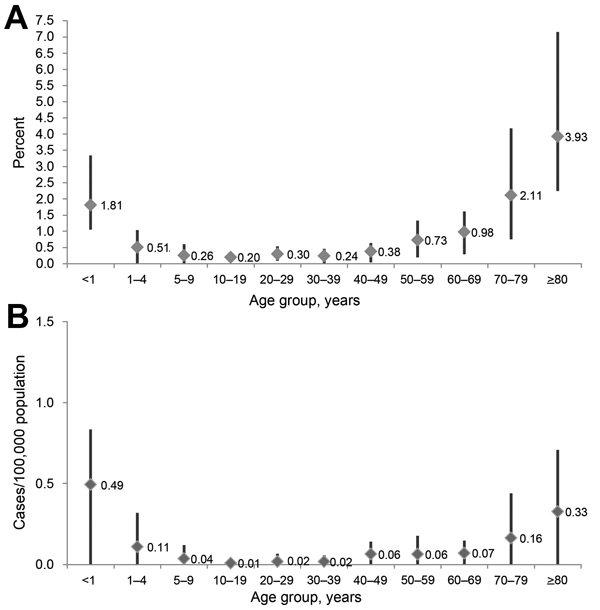
Figure 2. A) Cronobacter spp. incidence rates, by age group (overall and range by site) in the Foodborne Diseases Active Surveillance Network (FoodNet), 2003–2009. B) Cronobacter spp. incidence rates for invasive isolates by age group (overall and range by site), FoodNet, 2003–2009. Data are based on a sample from laboratories in 6 states (California, Colorado, Maryland, Minnesota, New Mexico, and Tennessee) in the FoodNet catchment area and are reported for 535 of 544 patients (age information missing for 9 patients).
Page created: August 13, 2014
Page updated: August 13, 2014
Page reviewed: August 13, 2014
The conclusions, findings, and opinions expressed by authors contributing to this journal do not necessarily reflect the official position of the U.S. Department of Health and Human Services, the Public Health Service, the Centers for Disease Control and Prevention, or the authors' affiliated institutions. Use of trade names is for identification only and does not imply endorsement by any of the groups named above.