Volume 21, Number 2—February 2015
Research
Simulation Study of the Effect of Influenza and Influenza Vaccination on Risk of Acquiring Guillain-Barré Syndrome
Steven Hawken, Jeffrey C. Kwong, Shelley L. Deeks, Natasha S. Crowcroft, Allison McGeer, Robin Ducharme, Michael A. Campitelli, Doug Coyle, and Kumanan Wilson
Figure 2
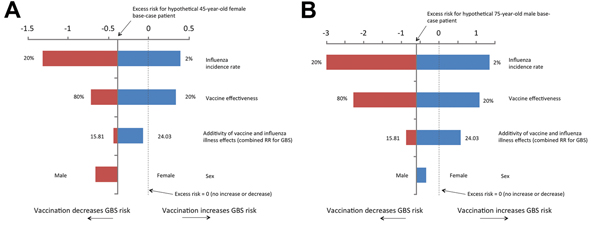
Figure 2. Sensitivity analyses for the excess risk of Guillain-Barré syndrome (GBS) per 1,000,000 influenza vaccinations. A) 45-year-old woman, assuming a 10% influenza incidence rate, 61% vaccine effectiveness, and combined relative risk (RR) of GBS of 17.33. B) 75-year-old man, assuming a 10% influenza incidence rate, vaccine effectiveness of 50% and combined RR of GBS of 17.33. Depending on the joint distribution of the probabilistic inputs to the simulation, these deterministic sensitivity analyses will not necessarily yield identical mean/median estimates to those from the probabilistic simulation for the same age, sex, and influenza incidence rate.
Page created: January 20, 2015
Page updated: January 20, 2015
Page reviewed: January 20, 2015
The conclusions, findings, and opinions expressed by authors contributing to this journal do not necessarily reflect the official position of the U.S. Department of Health and Human Services, the Public Health Service, the Centers for Disease Control and Prevention, or the authors' affiliated institutions. Use of trade names is for identification only and does not imply endorsement by any of the groups named above.