Volume 21, Number 4—April 2015
Letter
Co-infection with Avian (H7N9) and Pandemic (H1N1) 2009 Influenza Viruses, China
Figure
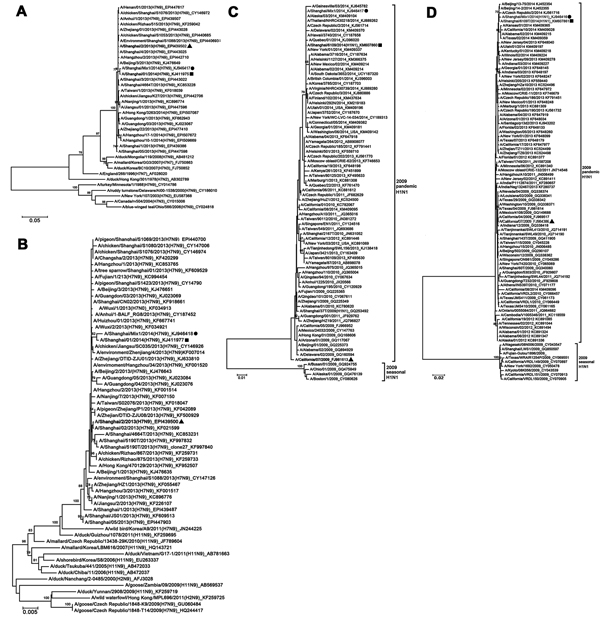
Figure. Phylogenetic analyses of A/Shanghai/Mix1/2014(H7N9) and A/Shanghai/Mix1/2014(H1N1) viruses from Shanghai, China, January 2014. A) Hemagglutinin and B) neuraminidase of A/Shanghai/Mix1/2014(H7N9); C) hemagglutinin and D) neuraminidase of A/Shanghai/Mix1/2014(H1N1). Multiple alignments were constructed by using the ClustalW (http://www.clustal.org/) algorithm based on the sequences of the hemagglutinin and neuraminidase genes. Genetic distances were calculated by using the Kimura 2-parameter method, and phylogenetic trees were constructed by using the neighbor-joining method with bootstrap analysis of 1,000 replicates in MEGA 5.1 (http://www.megasoftware.net). Horizontal distances are proportional to genetic distances. Numbers next to nodes indicate bootstrap value percentages (>70%). Circles indicate the A/Shanghai/Mix1/2014(H7N9) and A/Shanghai/Mix1/2014(H1N1) virus strains isolated from the co-infection patient from Shanghai, China. Triangles indicate the representative strains of the Shanghai area during the same period as the influenza (H7N9) outbreak in China. Squares indicate the representative strains of the Shanghai area during the same wave of the H7N9 outbreak in China. Scale bars indicate nucleotide substitutions per site. The Global Initiative on Sharing Avian Influenza Data database or GenBank accession numbers of the influenza viruses used in the construction of the phylogenetic analyses are displayed in the phylogenetic trees, which follow the taxon names.
1These authors contributed equally to this article.