Volume 21, Number 5—May 2015
Research
Transmission of Hepatitis C Virus among Prisoners, Australia, 2005–2012
Figure 1
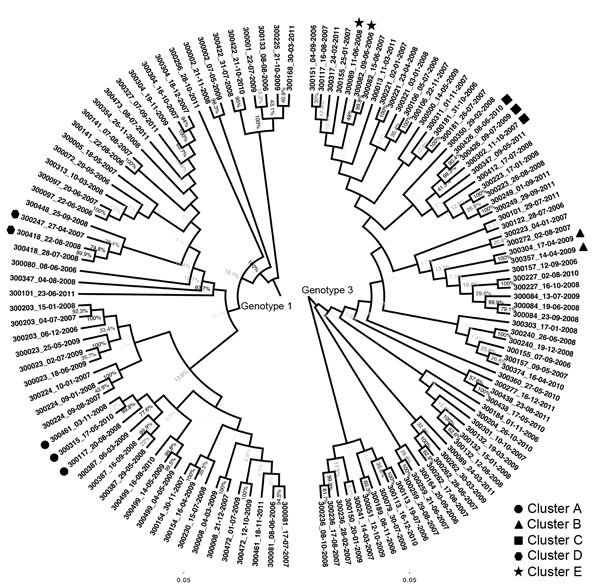
Figure 1. Phylogenetic trees composed of 129 sequences from 79 participants infected with hepatitis C virus genotypes (gt) 1a, 1b, or 3a, New South Wales, Australia, 2005–2012. Names on the tips of the tree represent participant identification numbers and are followed by the sample collection date. Each phylogenetic tree was generated separately from a maximum-likelihood model by using an HKY substitution model with gamma distribution. Bootstrap values are >80% for all branches of identified transmission clusters. Bootstrap values between branches representing sequences from the same host were lower than those between host branches. Identified transmission clusters are labeled with symbols. Scale bars indicate nucleotide substitutions per site.
1Additional HITS-p investigators are listed at the end of this article.