Skip directly to site content Skip directly to page options Skip directly to A-Z link Skip directly to A-Z link Skip directly to A-Z link
Volume 21, Number 5—May 2015
Research

Transmission of Hepatitis C Virus among Prisoners, Australia, 2005–2012

Neil Arvin Bretaña, Lies Boelen, Rowena Bull, Suzy Teutsch, Peter A. White, Andrew R. Lloyd, Fabio LucianiComments to Author , on behalf of the HITS-p investigators
Author affiliations: The University of New South Wales, Sydney, New South Wales, Australia (N.A. Bretaña, L. Boelen, R. Bull, S. Teutsch, P.A. White, A.R. Lloyd, F. Luciani); Imperial College London, London, UK (L. Boelen)

Main Article

Figure 4

Reconstruction of the likely hepatitis C virus transmission dynamics among prisoners in New South Wales, Australia, 2005–2012. Geographic representation of the transmission dynamics among 3 participants identified in cluster A over a 12-month period and co-location dynamics of these participants during October 2007–October 2008 between the prisons in New South Wales are shown. Participants moved between 4 prisons and between prisons and the outside community (arbitrarily located in the center of

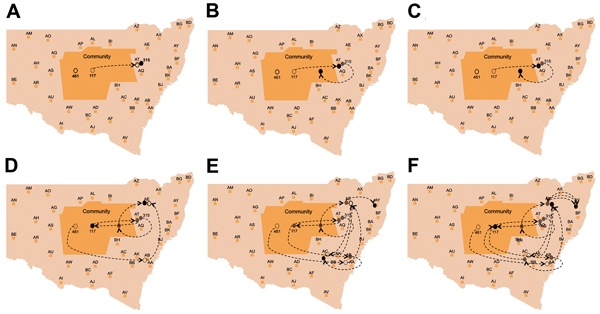
Figure 4. Reconstruction of the likely hepatitis C virus transmission dynamics among prisoners in New South Wales, Australia, 2005–2012. Geographic representation of the transmission dynamics among 3 participants identified in cluster A over a 12-month period and co-location dynamics of these participants during October 2007–October 2008 between the prisons in New South Wales are shown. Participants moved between 4 prisons and between prisons and the outside community (arbitrarily located in the center of the map of New South Wales). A) Time 0 (earliest record of location of the cluster members before co-location events occurred between any of the pairs within the cluster); B) 2 months after time 0; C) 4 months after time 0; D) 8 months after time 0. E) 10 months after 0, F) 12 months after time 0. Prisons are de-identified, indicated with a 2-letter code and random locations. Arrows represent the movement of participants between 2 prisons. Filled ovals indicate viremic participants; empty ovals indicate nonviremic patients; gray indicates previous location (past movements) of each participant.

Main Article

1Additional HITS-p investigators are listed at the end of this article.

Page created: April 20, 2015
Page updated: April 20, 2015
Page reviewed: April 20, 2015
The conclusions, findings, and opinions expressed by authors contributing to this journal do not necessarily reflect the official position of the U.S. Department of Health and Human Services, the Public Health Service, the Centers for Disease Control and Prevention, or the authors' affiliated institutions. Use of trade names is for identification only and does not imply endorsement by any of the groups named above.
file_external