Volume 22, Number 9—September 2016
Research
Staphylococcus aureus Regulatory RNAs as Potential Biomarkers for Bloodstream Infections
Figure 3
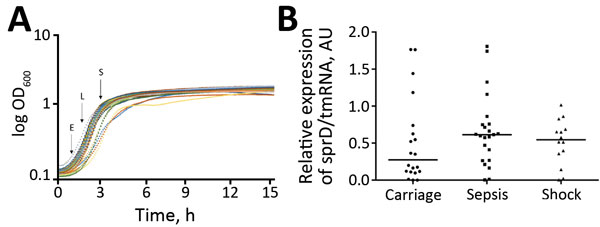
Figure 3. Expression of sprD in 61 Staphylococcus aureus isolates, Rennes, France. A) Representative growth curves. Each curve indicates 1 strain. Arrows indicate times at which the total RNAs were collected. E, early exponential growth phase; L, late exponential growth phase; S, stationary growth phase. B) Isolates analyzed for sprD (srn_3800) expression levels at E growth phase: 21 from asymptomatic carriers, 23 from patients persons with nonsevere sepsis, and 17 from patients with septic shock. For normalization, quantitative PCR was used to determine expression of tmRNA for each isolate as internal loading controls. Horizontal lines indicate medians. Using the comparative cycle threshold method, we normalized the amount of sprD against that of tmRNA relative to that of control strain L102 (methicillin-susceptible S. aureus colonization strain). Each symbol indicates mean for 3 independent experiments. p = 0.09 for isolates from asymptomatic carriers versus isolates from patients with sepsis. AU, arbitrary units; log OD600, log optical density at 600 nm; ST, sequence type; sRNA, small RNA; spr, small pathogenicity island RNA; tmRNA, transfer–messenger RNA.