Volume 23, Number 1—January 2017
Dispatch
Reconstruction of Zika Virus Introduction in Brazil
Figure 1
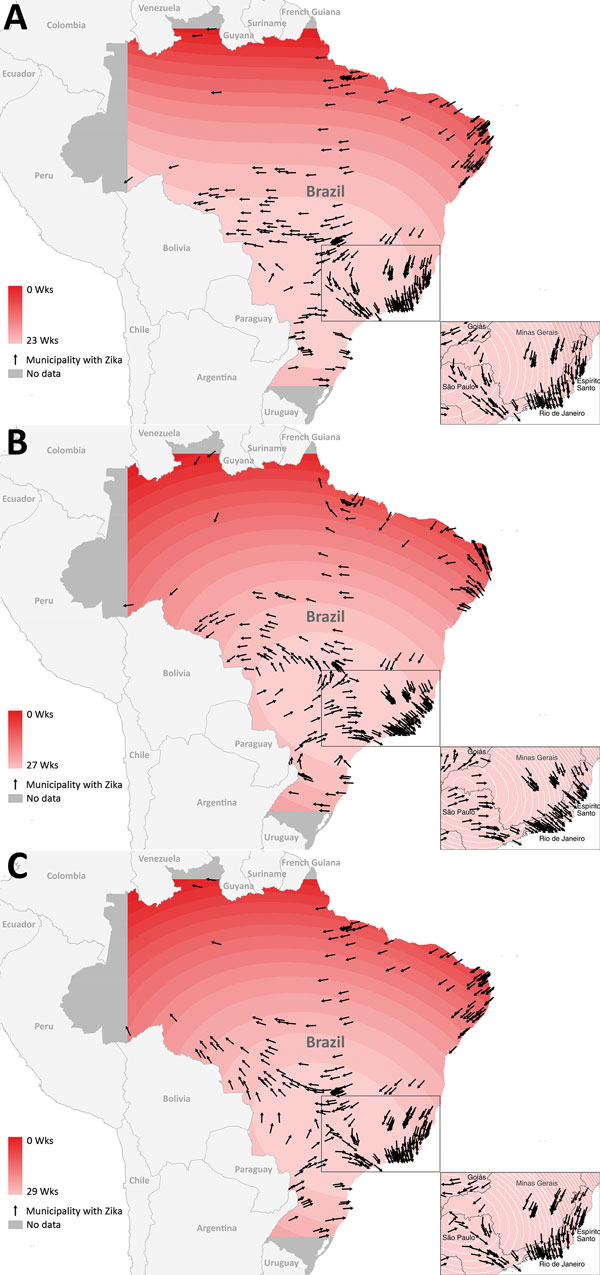
Figure 1. Contour surface trends and directional vectors for reconstructing Zika introduction in Brazil. A) Date of case registration (model 1); B) earliest date between date of symptom onset (if available) and date of registration (model 2); C) earliest date between date of case registration, date of symptom onset, and date of case reporting by other sources (model 3). Each contour line represents a 1-day period, and contour lines farther apart show that the disease spread rapidly through an area, whereas lines close together show slower progression in an area. Arrows indicate direction of Zika spread. Magnitude of speed and direction should be interpreted cautiously near the edges of the study area. Estimates of speed are subject to edge effects, which indicates that estimates are less stable because they are based on fewer data (not as many neighboring values).