Volume 23, Number 1—January 2017
Dispatch
Reconstruction of Zika Virus Introduction in Brazil
Kate Zinszer , Kathryn Morrison, John S. Brownstein, Fatima Marinho, Alexandre F. Santos, and Elaine O. Nsoesie
Figure 2
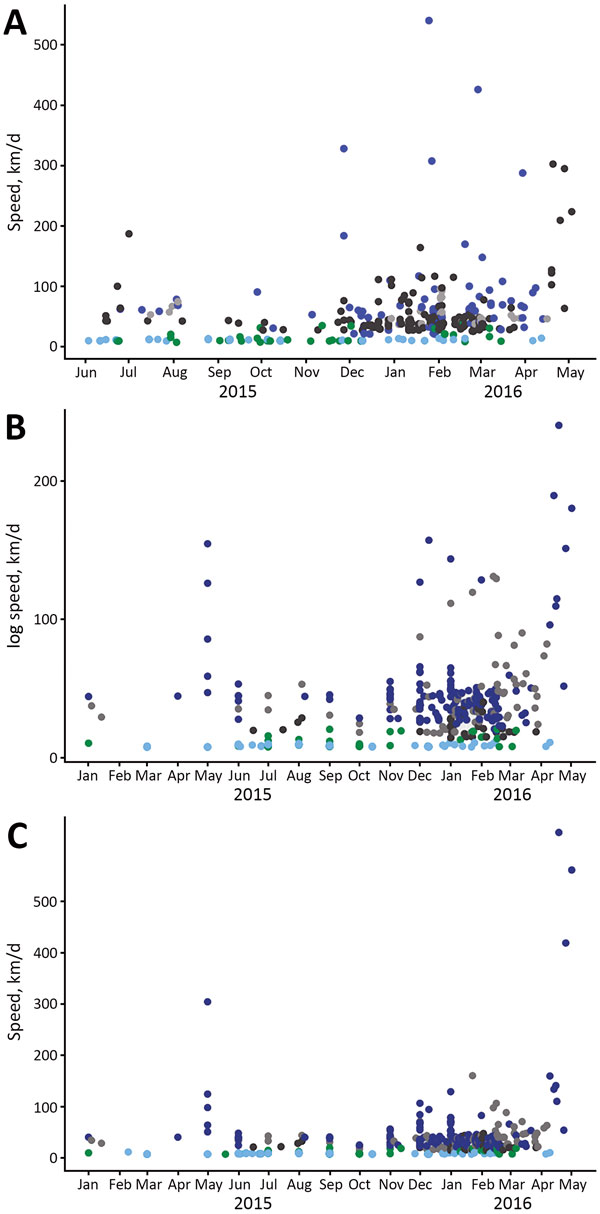
Figure 2. Speed or log speed (km/d) of Zika introduction into municipalities in Brazil. A) June 2015–May 2016; B) January 2015–May 2016; C) January 2015–May 2016. Municipalities are classified by region. Gray circles indicate central–western region, green circles indicate northern region, light blue circles indicate northeastern region, black circles indicate southern region, and dark blue circles indicate southeastern region.
Page created: December 14, 2016
Page updated: December 14, 2016
Page reviewed: December 14, 2016
The conclusions, findings, and opinions expressed by authors contributing to this journal do not necessarily reflect the official position of the U.S. Department of Health and Human Services, the Public Health Service, the Centers for Disease Control and Prevention, or the authors' affiliated institutions. Use of trade names is for identification only and does not imply endorsement by any of the groups named above.