Volume 23, Number 11—November 2017
Research
Weather-Dependent Risk for Legionnaires’ Disease, United States
Jacob E. Simmering, Linnea A. Polgreen, Douglas B. Hornick, Daniel K. Sewell, and Philip M. Polgreen
Figure 1
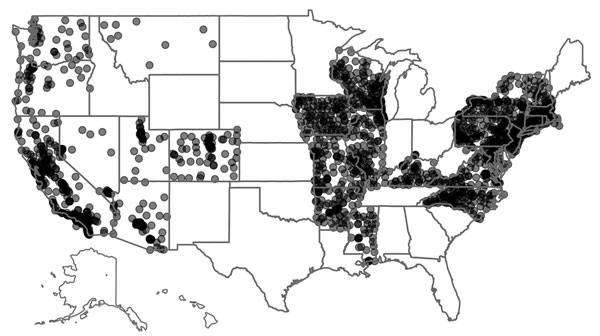
Figure 1. Locations of Healthcare Cost and Utilization Project (HCUP) hospitals used in the analysis of risk for Legionnaires’ disease, 26 US states, 1998–2011. Because many hospitals are near each other, each hospital was plotted as a faint point. When multiple points overlap, the area becomes darker because of the stacking of the points. Thus, there are faint spots in more rural areas and dark clusters in more urban areas.
Page created: October 16, 2017
Page updated: October 16, 2017
Page reviewed: October 16, 2017
The conclusions, findings, and opinions expressed by authors contributing to this journal do not necessarily reflect the official position of the U.S. Department of Health and Human Services, the Public Health Service, the Centers for Disease Control and Prevention, or the authors' affiliated institutions. Use of trade names is for identification only and does not imply endorsement by any of the groups named above.