Volume 23, Number 2—February 2017
Synopsis
Changing Epidemiology of Human Brucellosis, China, 1955–2014
Shengjie Lai1, Hang Zhou1, Weiyi Xiong1, Hongjie Yu, Zhuojie Huang, Jianxing Yu, Wenwu Yin, Liping Wang, Qiulan Chen, Yu Li, Di Mu, Lingjia Zeng, Xiang Ren, Mengjie Geng, Zike Zhang, Buyun Cui, Tiefeng Li, Dali Wang, Qiao Sun, Nicola A. Wardrop, Andrew J. Tatem, and Sheng Wei
Figure 1
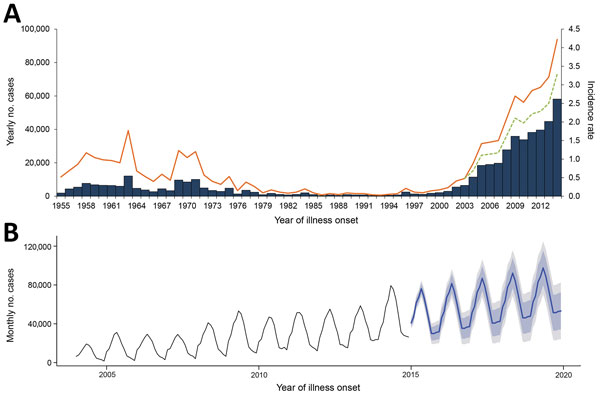
Figure 1. Reported human brucellosis cases (N = 513,034), mainland China, 1955–2014. A) Aggregated number of cases (blue bars) and annual incidence rate (orange line) per 100,000 residents reported by year. The adjusted incidence rate (green dashed line) was estimated by an excess proportion (22.06%) that might be attributed to the effect of Internet-based reporting since 2004 (see Methods). B) Forecast of the monthly number of cases (blue line) during 2015–2019 by Holt-Winters exponential smoothing with 80% CIs (light gray) and 95% CIs (dark gray) based on monthly numbers for 2004–2014.
1These authors contributed equally to this article.
Page created: January 17, 2017
Page updated: January 17, 2017
Page reviewed: January 17, 2017
The conclusions, findings, and opinions expressed by authors contributing to this journal do not necessarily reflect the official position of the U.S. Department of Health and Human Services, the Public Health Service, the Centers for Disease Control and Prevention, or the authors' affiliated institutions. Use of trade names is for identification only and does not imply endorsement by any of the groups named above.