Volume 23, Number 2—February 2017
Synopsis
Changing Epidemiology of Human Brucellosis, China, 1955–2014
Shengjie Lai1, Hang Zhou1, Weiyi Xiong1, Hongjie Yu, Zhuojie Huang, Jianxing Yu, Wenwu Yin, Liping Wang, Qiulan Chen, Yu Li, Di Mu, Lingjia Zeng, Xiang Ren, Mengjie Geng, Zike Zhang, Buyun Cui, Tiefeng Li, Dali Wang, Qiao Sun, Nicola A. Wardrop, Andrew J. Tatem, and Sheng Wei
Figure 3
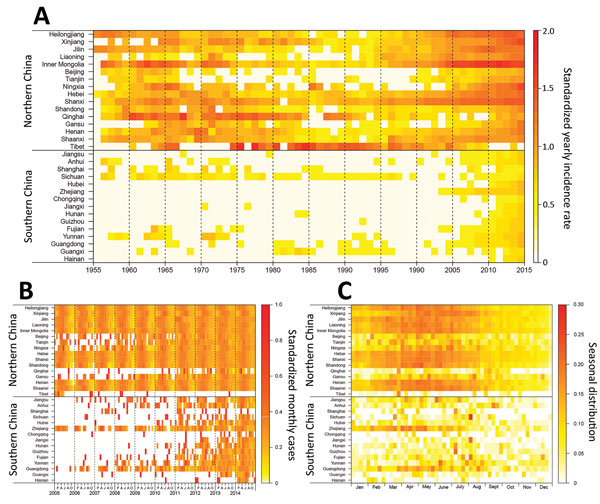
Figure 3. Heat map of provinces with human brucellosis cases, by north and south and the latitude of the capital city of each province, China. A) Time series of incidence rate per 100,000 residents during 1955–2014, standardized by the eighth root. B) Time series of monthly cases, 2005–2014, standardized by the annual number of cases reported by each province. C) Seasonal distribution of cases by province, plotted as the mean value of the proportion of cases in each week of the year from 2005 through 2014.
1These authors contributed equally to this article.
Page created: January 17, 2017
Page updated: January 17, 2017
Page reviewed: January 17, 2017
The conclusions, findings, and opinions expressed by authors contributing to this journal do not necessarily reflect the official position of the U.S. Department of Health and Human Services, the Public Health Service, the Centers for Disease Control and Prevention, or the authors' affiliated institutions. Use of trade names is for identification only and does not imply endorsement by any of the groups named above.