Skip directly to site content Skip directly to page options Skip directly to A-Z link Skip directly to A-Z link Skip directly to A-Z link
Volume 23, Number 2—February 2017
Research

Detection of Multiple Parallel Transmission Outbreak of Streptococcus suis Human Infection by Use of Genome Epidemiology, China, 2005

Pengcheng Du1, Han Zheng1, Jieping Zhou1, Ruiting Lan1, Changyun Ye, Huaiqi Jing, Dong Jin, Zhigang Cui, Xuemei Bai, Jianming Liang, Jiantao Liu, Lei Xu, Wen Zhang, Chen Chen, Jianguo XuComments to Author , and Chen
Author affiliations: State Key Laboratory for Infectious Disease Prevention and Control, Beijing, China (P. Du, H. Zheng, H. Jing, D. Jin, Z. Cui, X. Bai, L. Xu, W. Zhang, C. Chen, J. Xu); Academy of Sciences of China Institute of Remote Sensing and Digital Earth, Beijing (J. Zhou, J. Liang, J. Liu); University of New South Wales School of Biotechnology and Biomolecular Sciences, Sydney, Australia (R. Lan); Collaborative Innovation Center for Diagnosis and Treatment of Infectious Diseases, Beijing (C. Ye, J. Xu); National Institute for Communicable Disease Control and Prevention, Beijing (D. Jin)

Main Article

Figure 3

Geographic spread of the 5 outbreak clades of Streptococcus suis minimum core genome type 1 sequence type 7 before and during outbreak of S. suis human infections, Sichuan Province, China, 2005. Phylogenetic relationship of isolates within a clade is detailed in Technical Appendix 2 Figure 1). Lineages that developed before 2005 are marked with dashed lines. Clades are displayed separately around the map for better visualization of their geographic distribution. Locations are marked by bubbles i

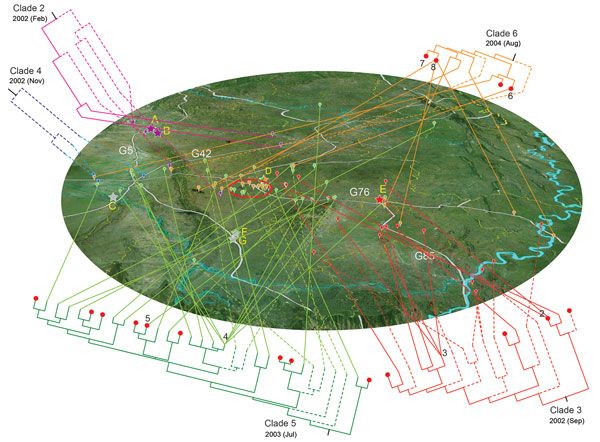
Figure 3. Geographic spread of the 5 outbreak clades of Streptococcus suis minimum core genome type 1 sequence type 7 before and during outbreak of S. suis human infections, Sichuan Province, China, 2005. Phylogenetic relationship of isolates within a clade is detailed in Technical Appendix 2 Figure 1). Lineages that developed before 2005 are marked with dashed lines. Clades are displayed separately around the map for better visualization of their geographic distribution. Locations are marked by bubbles in different colors (clades 2–6 are purple, red, blue, green, and orange respectively). The isolates in the same epidemiologically interesting group are collapsed at the tip of the tree and identified by their group number. Bubbles in the red ellipse on the map represent isolates from the most concentrated outbreak region of Ziyang city; red plots on the tree represent these isolates; stars represent the piglet breeding companies.

Main Article

1These authors contributed equally to this article.

Page created: January 17, 2017
Page updated: January 17, 2017
Page reviewed: January 17, 2017
The conclusions, findings, and opinions expressed by authors contributing to this journal do not necessarily reflect the official position of the U.S. Department of Health and Human Services, the Public Health Service, the Centers for Disease Control and Prevention, or the authors' affiliated institutions. Use of trade names is for identification only and does not imply endorsement by any of the groups named above.
file_external