Volume 23, Number 4—April 2017
Research
Influence of Referral Pathway on Ebola Virus Disease Case-Fatality Rate and Effect of Survival Selection Bias
Frauke Rudolf , Mads Damkjær, Suzanne Lunding, Kenn Dornonville de la Cour, Alyssa Young, Tim Brooks, Tom Sesay, Alex P. Salam, Sharmistha Mishra, and Merete Storgaard
Figure
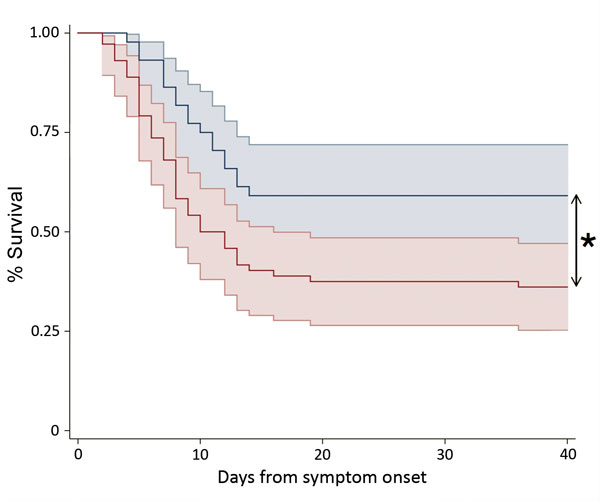
Figure. Kaplan-Meier survival plot stratified by referral pathway for patients admitted directly to an Ebola treatment center (ETC) with confirmed Ebola virus disease (cohort 1, blue line) and for patients diagnosed at the ETC (cohort 2, red line). Plots show the percentage of patients surviving as a function of time (days) from reported symptom onset. Shaded areas indicate 95% CIs. *p<0.05.
Page created: March 16, 2017
Page updated: March 16, 2017
Page reviewed: March 16, 2017
The conclusions, findings, and opinions expressed by authors contributing to this journal do not necessarily reflect the official position of the U.S. Department of Health and Human Services, the Public Health Service, the Centers for Disease Control and Prevention, or the authors' affiliated institutions. Use of trade names is for identification only and does not imply endorsement by any of the groups named above.