Skip directly to site content Skip directly to page options Skip directly to A-Z link Skip directly to A-Z link Skip directly to A-Z link
Volume 23, Number 6—June 2017
Dispatch

Isolated Case of Marburg Virus Disease, Kampala, Uganda, 2014

Luke Nyakarahuka, Joseph Ojwang, Alex Tumusiime, Stephen Balinandi, Shannon Whitmer, Simon Kyazze, Sam Kasozi, Milton Wetaka, Issa Makumbi, Melissa Dahlke, Jeff Borchert, Julius Lutwama, Ute Ströher, Pierre E. Rollin, Stuart T. Nichol, and Trevor R. ShoemakerComments to Author 
Author affiliations: Uganda Virus Research Institute, Entebbe, Uganda (L. Nyakarahuka, J. Lutwama); US Centers for Disease Control and Prevention, Entebbe (J. Ojwang, A. Tumusiime, S. Balinandi, J. Borchert, T.R. Shoemaker); Centers for Disease Control and Prevention, Atlanta, Georgia, USA (S. Whitmer, U. Ströher, P.E. Rollin, S.T. Nichol); Public Health Emergency Operations Center, Kampala, Uganda (S. Kyazze, S. Kasozi, M. Wetaka, I. Makumbi, M. Dahlke)

Main Article

Figure 2

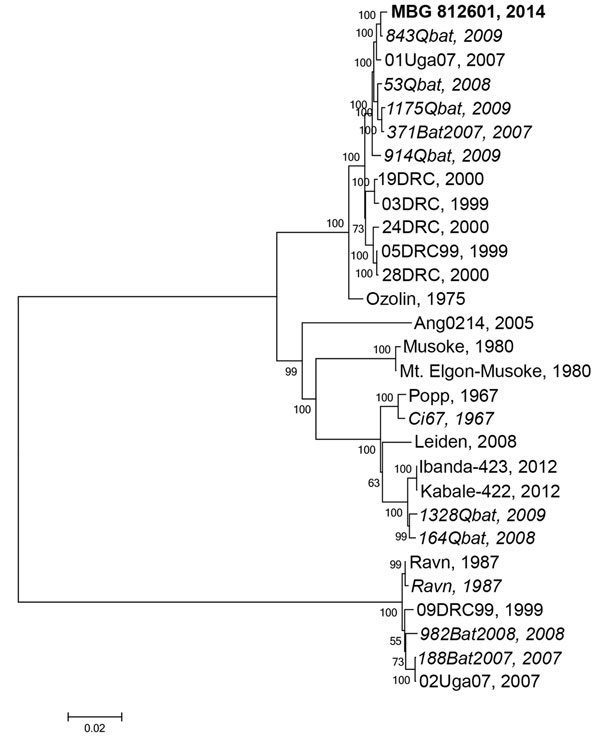
Phylogenetic tree comparing complete or nearly complete Marburg virus (MARV) genomes sequenced from bat and human sources in Uganda. A consensus whole-genome sequence was assembled by mapping reads to the reference MARV sequence NC_001608 using CLC Genomics Workbench (Waltham, MA, USA). A phylogenetic tree was constructed using MEGA6.06 (http://www.megasoftware.net). Viral sequences acquired from human sources are in standard type, and viral sequences acquired from bats are italicized; the seque

Figure 2. Phylogenetic tree comparing complete or nearly complete Marburg virus (MARV) genomes sequenced from bat and human sources in Uganda. A consensus whole-genome sequence was assembled by mapping reads to the reference MARV sequence NC_001608 using CLC Genomics Workbench (Waltham, MA, USA). A phylogenetic tree was constructed using MEGA6.06 (http://www.megasoftware.net). Viral sequences acquired from human sources are in standard type, and viral sequences acquired from bats are italicized; the sequence from the human case-patient described in this study, MBG 812601 2014, is in bold. Evolutionary history was inferred using the maximum-likelihood method based on the Tamura-Nei model with MEGA6.06. The tree is drawn to scale, with branch lengths measured in the number of substitutions per site. Values at nodes represent bootstrap values following 1,000 replicates. Scale bar represents substitutions per site. GenBank accession numbers used in this tree are KP985768, JX458855.1, FJ750957.1, JX458852.1, JX458854.1, FJ750958.1, JX458856.1, JX458828.1, JX458826.1, JX458834.1, DQ447651.1, JX458846.1, AY358025.2, DQ447657.1, Z12132.1, NC_001608.3, Z29337.1, EF446132.1, JN408064.1, KC545388.1, KC545387.1, DQ447649.1, EF446131.1, DQ447652.1, FJ750956.1, FJ750955.1, and FJ750953.1.

Main Article

Page created: May 16, 2017
Page updated: May 16, 2017
Page reviewed: May 16, 2017
The conclusions, findings, and opinions expressed by authors contributing to this journal do not necessarily reflect the official position of the U.S. Department of Health and Human Services, the Public Health Service, the Centers for Disease Control and Prevention, or the authors' affiliated institutions. Use of trade names is for identification only and does not imply endorsement by any of the groups named above.
file_external