Volume 23, Number 8—August 2017
Research
Clinical Laboratory Values as Early Indicators of Ebola Virus Infection in Nonhuman Primates
Figure 2
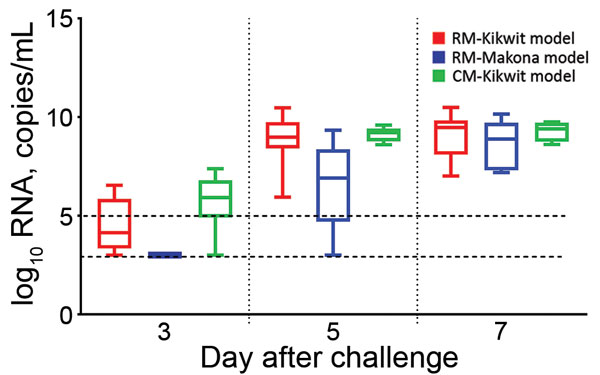
Figure 2. log10 RNA level, by day after EBOV challenge, for each of 3 nonhuman primate models of Ebola virus disease. Box and whisker plots were created by using the available data for each day. Boxes indicate range from 25th (bottom line) to 75th (top line) percentiles; horizontal line within each box indicates median; whiskers indicate entire range of values (maximum to minimum). Dashed lines indicate limit of detection (LOD) (bottom line, 3.0 log10 RNA copies/mL) and lower limit of quantification (LLOQ) (top line, 5.0 log10 RNA copies/mL) for the assay. Values below the LOD were assigned the value 3.0 log10 RNA copies/mL; values between the LLOQ and the LOD were assigned the actual measured value. CM-Kikwit, cynomolgus macaque model of EBOV Kikwit strain; EBOV, Ebola virus; RM-Kikwit, rhesus macaque model of EBOV Kikwit strain; RM-Makona, rhesus macaque model of EBOV Makona strain.