Volume 23, Number 9—September 2017
Research
Real-Time Whole-Genome Sequencing for Surveillance of Listeria monocytogenes, France
Alexandra Moura1, Mathieu Tourdjman1, Alexandre Leclercq1, Estelle Hamelin, Edith Laurent, Nathalie Fredriksen, Dieter Van Cauteren, Hélène Bracq-Dieye, Pierre Thouvenot, Guillaume Vales, Nathalie Tessaud-Rita, Mylène M. Maury, Andreea Alexandru, Alexis Criscuolo, Emmanuel Quevillon, Marie-Pierre Donguy, Vincent Enouf, Henriette de Valk, Sylvain Brisse2, and Marc Lecuit2
Figure 2
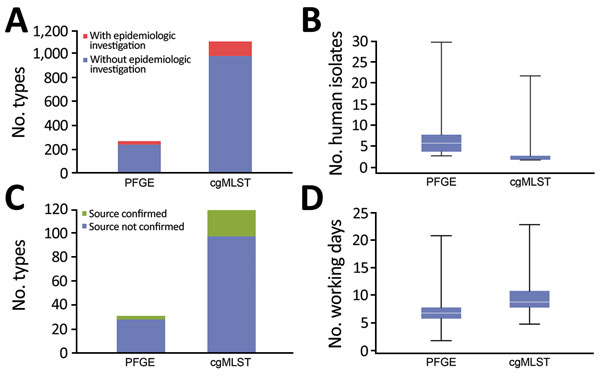
Figure 2. Comparison of pulsed-field gel electrophoresis (PFGE) and core genome multilocus sequence typing (cgMLST) for surveillance of Listeria monocytogenes, France. A) Number of total types and number of types triggering epidemiologic alerts. B) Number of human isolates per epidemiologic alert. C) Number of types within epidemiologic alerts with identified source. D) Time delay (days) between obtaining isolate and typing results. Horizontal lines in panels B and D indicate medians, and boxes indicate 25th and 75th percentiles. Error bars indicate maximum and minimum values.
1These authors contributed equally to this article.
2These authors were co-senior authors.
Page created: August 14, 2017
Page updated: August 14, 2017
Page reviewed: August 14, 2017
The conclusions, findings, and opinions expressed by authors contributing to this journal do not necessarily reflect the official position of the U.S. Department of Health and Human Services, the Public Health Service, the Centers for Disease Control and Prevention, or the authors' affiliated institutions. Use of trade names is for identification only and does not imply endorsement by any of the groups named above.