Volume 23, Number 9—September 2017
Dispatch
Genetic Diversity of Highly Pathogenic Avian Influenza A(H5N8/H5N5) Viruses in Italy, 2016–17
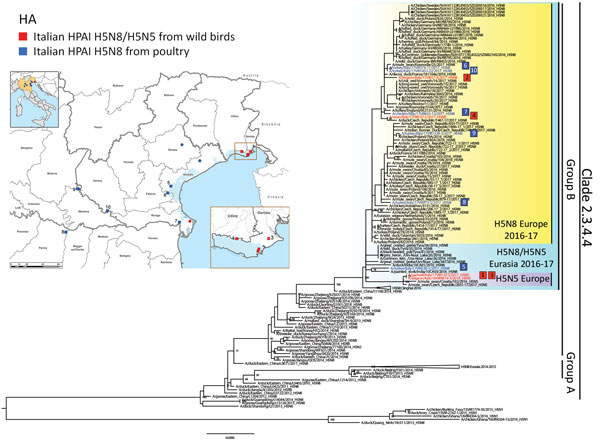
Figure 1

Figure 1. Highly pathogenic avian influenza A(H5N8) and A(H5N5) in birds, Italy, 2016–17). A) Geographic distribution of cases in wild (red) and domestic (blue) birds in northern Italy. Squares indicate the samples sequenced in this study; circles indicate positive samples for which no genetic information was available at the time of writing. B) Maximum likelihood phylogenetic tree of the hemagglutinin gene of clade 2.3.4.4 viruses. Viruses analyzed in this study are indicated with red (wild birds) and blue (domestic birds) squares, numbered according to the collection date. Bootstrap supports >60% are indicated above the nodes. Scale bar indicates nucleotide substitutions per site.
1These authors contributed equally to this article.
Page created: August 17, 2017
Page updated: August 17, 2017
Page reviewed: August 17, 2017
The conclusions, findings, and opinions expressed by authors contributing to this journal do not necessarily reflect the official position of the U.S. Department of Health and Human Services, the Public Health Service, the Centers for Disease Control and Prevention, or the authors' affiliated institutions. Use of trade names is for identification only and does not imply endorsement by any of the groups named above.