Volume 24, Number 1—January 2018
Dispatch
Serologic Evidence of Fruit Bat Exposure to Filoviruses, Singapore, 2011–2016
Eric D. Laing1, Ian H. Mendenhall1, Martin Linster, Dolyce H. W. Low, Yihui Chen, Lianying Yan, Spencer L. Sterling, Sophie Borthwick, Erica Sena Neves, Julia S. L. Lim, Maggie Skiles, Benjamin P. Y.-H. Lee, Lin-Fa Wang, Christopher C. Broder, and Gavin J. D. Smith
Figure 1
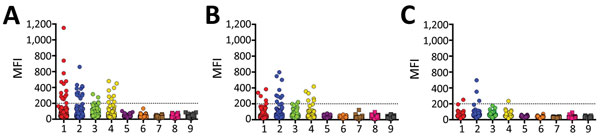
Figure 1. Mean fluorescence intensity (MFI) values obtained from Bio-Plex assay (Bio-Rad, Hercules, CA, USA) screening of individual serum samples from bats of 3 species with soluble filovirus glycoproteins. Dashed line indicates the cutoff value at 200 MFI. 1, Zaire ebolavirus; 2, Bundibugyo ebolavirus; 3, Taï Forest ebolavirus; 4, Sudan ebolavirus; 5, Reston ebolavirus–monkey; 6, Reston ebolavirus–pig; 7, Marburg virus–Musoke; 8, Marburg virus–Angola; 9, Ravn virus.
1These authors contributed equally to this article.
Page created: December 19, 2017
Page updated: December 19, 2017
Page reviewed: December 19, 2017
The conclusions, findings, and opinions expressed by authors contributing to this journal do not necessarily reflect the official position of the U.S. Department of Health and Human Services, the Public Health Service, the Centers for Disease Control and Prevention, or the authors' affiliated institutions. Use of trade names is for identification only and does not imply endorsement by any of the groups named above.