Volume 24, Number 1—January 2018
Research
Changing Geographic Patterns and Risk Factors for Avian Influenza A(H7N9) Infections in Humans, China
Figure 2

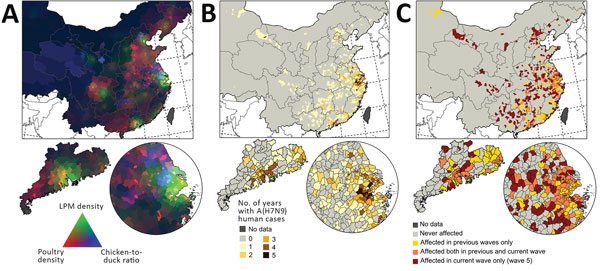
Figure 2. Distribution of predictor variables and influenza A(H7N9) infections in China, with 3 geographic extents: smallest extent around the location of human cases (top), Guangdong Province (bottom left), and Yangtze River Delta (bottom right). A) Visualization of poultry density (red), live-poultry market density (green), and chicken-to-duck ratio (blue). Dark areas correspond to low values and light areas to high values in all 3 predictors. B) Number of years with >1 human case per county. C) Distribution of the fifth wave of human infections compared with previous waves.
1These authors contributed equally to this article.
Page created: December 19, 2017
Page updated: December 19, 2017
Page reviewed: December 19, 2017
The conclusions, findings, and opinions expressed by authors contributing to this journal do not necessarily reflect the official position of the U.S. Department of Health and Human Services, the Public Health Service, the Centers for Disease Control and Prevention, or the authors' affiliated institutions. Use of trade names is for identification only and does not imply endorsement by any of the groups named above.