Volume 25, Number 10—October 2019
Research
Comparison of Serologic Assays for Middle East Respiratory Syndrome Coronavirus
Figure 3
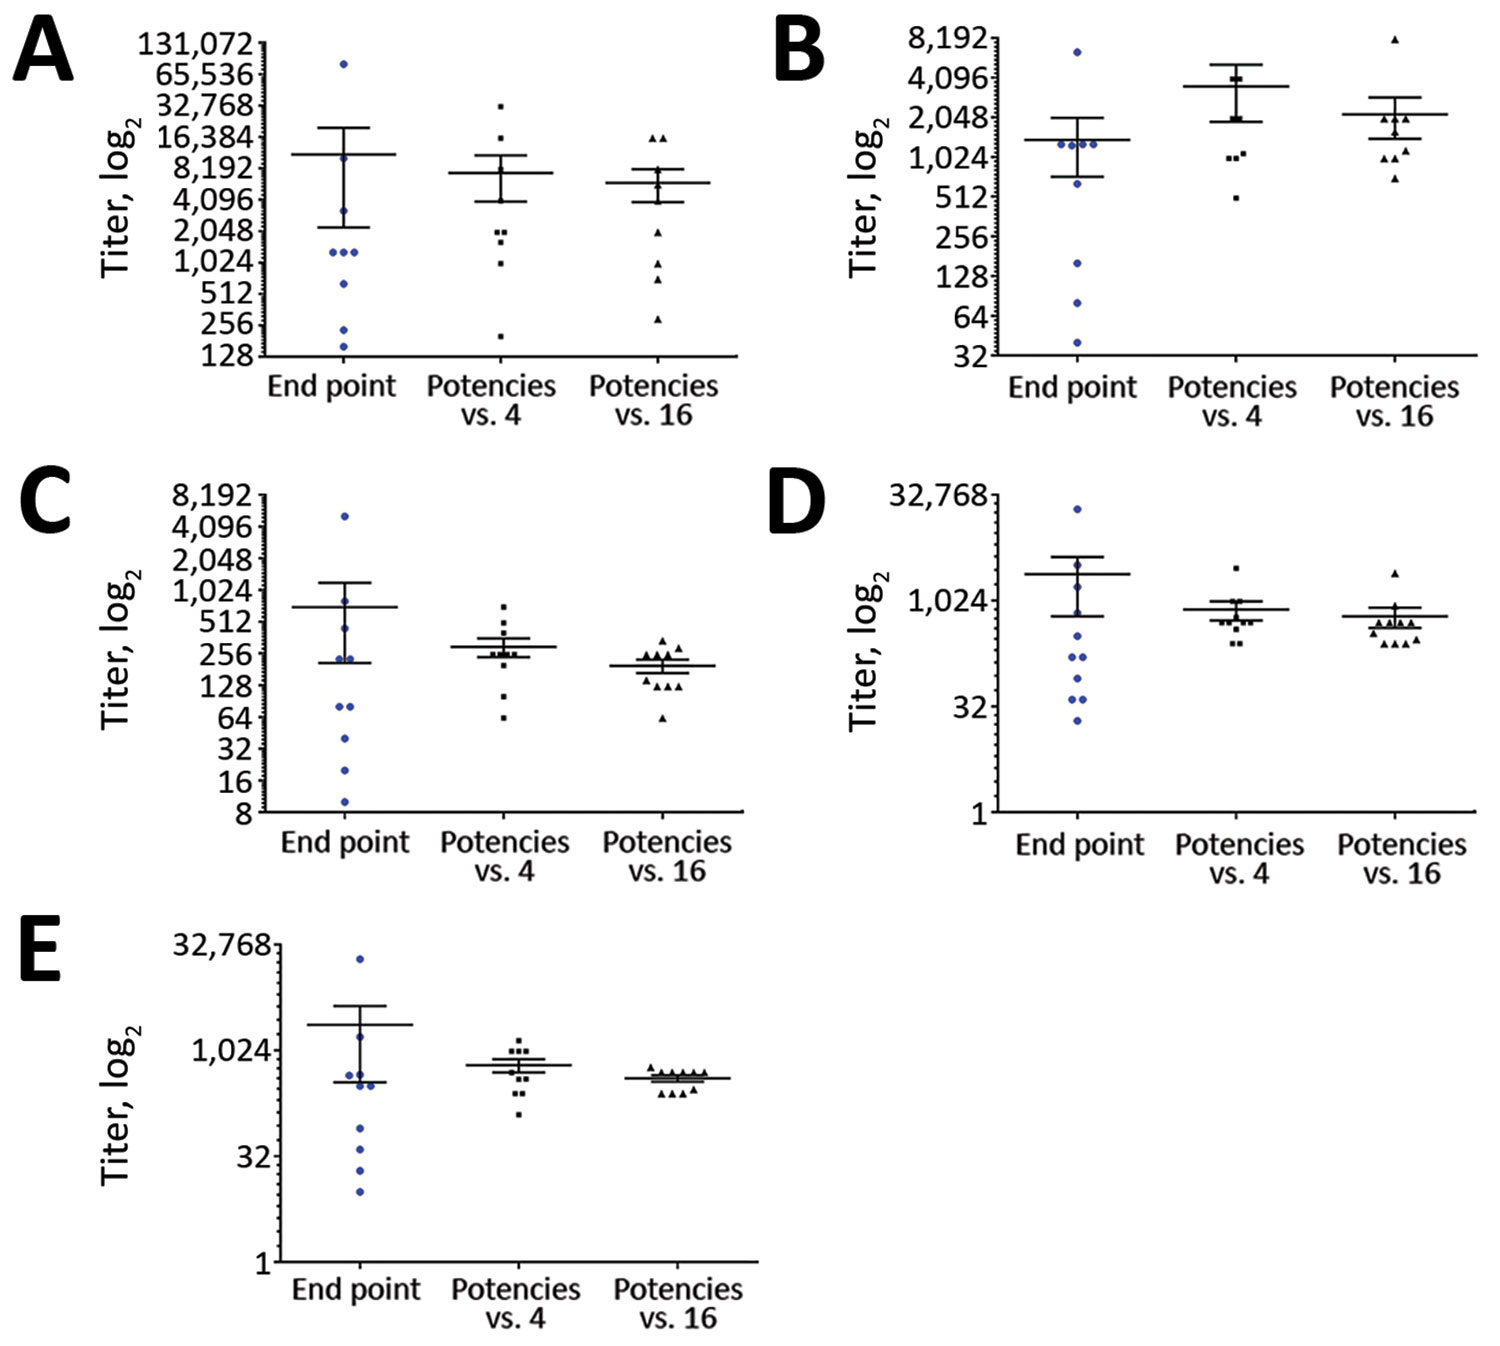
Figure 3. Relative titers of the individual positive patient plasma sample against a reference standard in study of serologic assays for MERS-CoV. Each panel represents a MERS-CoV–positive patient plasma sample: sample 1 (A), sample 5 (B), sample 9 (C), sample 11 (D), sample 12 (E). In each panel, the first data column shows the spread of endpoint titers from all quantitative assays performed; the second and third columns show quantitative results expressed as a potency relative to either sample 4 (Tc Bovine IgG raised against whole virus) or sample 16 (high-positive serum pool A), In each case the sample used as a reference was assigned nominal potency of 1,000 and all other samples were expressed as relative to the reference sample. For each dataset, horizontal line indicates the mean; error bars show SEM. MERS-CoV, Middle East respiratory syndrome coronavirus.
1Study participants who contributed data are listed at the end of this article.